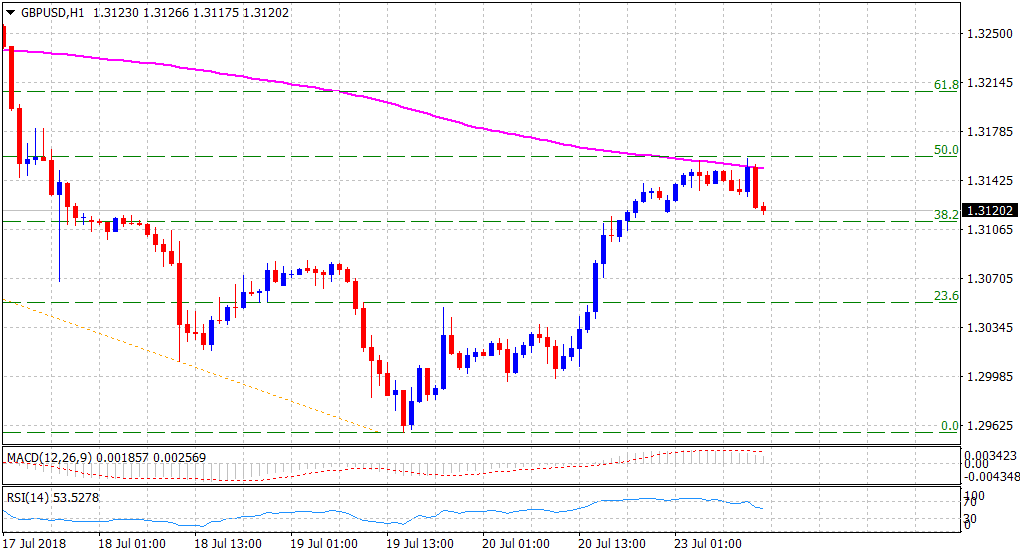
“¢ The pair’s goodish recovery move from YTD lows stalls near a confluence resistance, comprising of 200-hour SMA and 50% Fibonacci of the 1.3363-1.2957 recent downfall.
“¢ Meanwhile, technical indicators on the hourly chart continue to hold in positive territory and might attract some dip-buying interest at lower levels.
“¢ However, a convincing break below 1.3080-75 support area would mark the end of a corrective bounce and negate prospects for any further recovery in the near-term.
Spot rate: 1.3120
Daily High: 1.3158
Trend: Neutral
Resistance
R1: 1.3158 (current day swing high)
R2: 1.3186 (20-day SMA)
R3: 1.3200 (round figure mark)
Support
S1: 1.3085 (100-period SMA H1)
S2: 1.3037 (S1 daily pivot-point)
S3: 1.3000 (psychological round figure mark)
