- USD/JPY is keeping the trading range theme intact this Monday as USD/JPY found resistance at the 111.16 resistance.
- As the 50, 100 and 200-period simple moving averages are coiled together the market lacks a clear directionality.
- However, a daily close below last week low at 110.58 would likely be seen as a bearish clue and more selling can be on the cards in such scenario. The 110.27 level, July 4 low, would be the first scaling point to the downside.
USD/JPY 15-minute chart
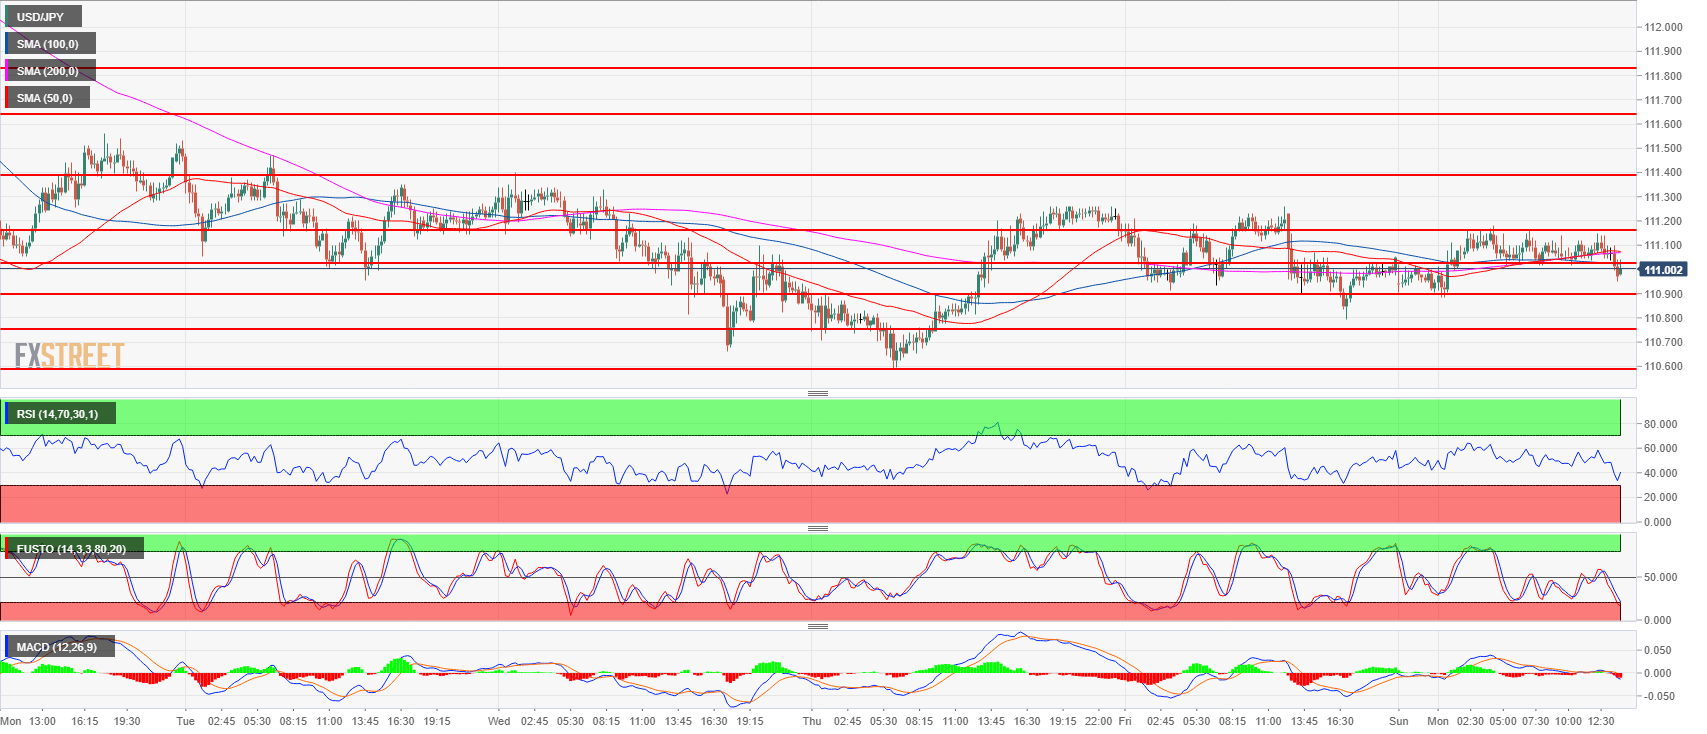
Spot rate: 111.00
Relative change: -0.04%
High: 111.18
Low: 110.88
Trend: Neutral / Bearish on a close below 110.58
Resistance 1: 111.02-111.16 previous intraday swing lows
Resistance 2: 111.39 May 21 swing high
Resistance 3: 111.60-111.80 area, 23.6% and 38.2% Fibonacci retracement low/high July 11
Resistance 4: 112.19-112.40 area, July 11 high and intraday swing low
Resistance 5: 112.64 July 12 high
Resistance 6: 113.18, 2018 high
Resistance 7: 113.26-113.38, 200-weekly simple moving average and January 8 high
Resistance 8: 114.45 October 27, 2017 high
Support 1: 110.90 June 15 swing high
Support 2: 110.75, July 23 low
Support 3: 110.58 July 26 low
Support 4: 110.27 July 4 low
