“¢ The early attempted up-move turned out to be short-lived, with bears now aiming towards challenging a short-term ascending trend-line support on the 15-min chart.
“¢ With technical indicators on the said chart gradually picking up negative momentum, a convincing break below the mentioned support should pave the way for an extension of the ongoing retracement slide from levels beyond the 112.00 handle.
“¢ Only a sustained move back above Friday’s swing high resistance, around the 111.85 region, might help negate any near-term negative bias and help the pair to build on last week’s modest gains.
USD/JPY 15-mins chart
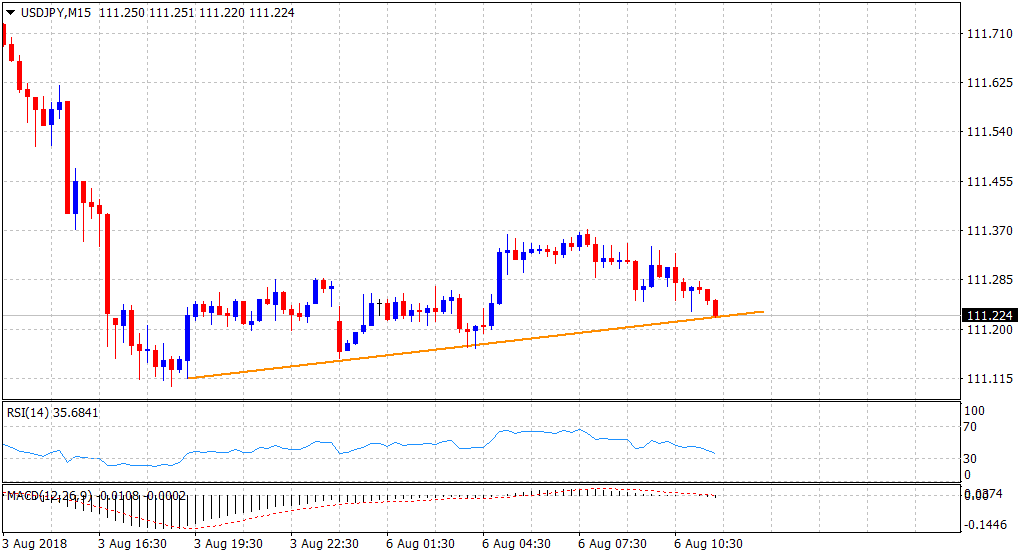
Spot rate: 111.22
Daily High: 111.37
Daily Low: 111.15
Trend: Turning bearish
Resistance
R1: 111.37 (current day swing high)
R2: 111.72 (100-period SMA H4)
R3: 112.19 (R2 daily pivot-point)
Support
S1: 110.95 (horizontal zone)
S2: 110.59 (July 26 swing low)
S3: 110.15 (S3 daily pivot-point)
