“¢ The commodity struggled to build on its positive momentum beyond 100-hour SMA for the second consecutive session and was being capped by resurgent USD demand.
“¢ Technical indicators on the 1-hourly chart have started drifting into negative territory, suggesting a continuation of the downward trajectory back towards YTD lows.
“¢ Only a sustained move beyond the 100-hour SMA barrier might negate the negative outlook and trigger a near-term short-covering bounce beyond $1220 supply zone.
Gold 1-hourly chart
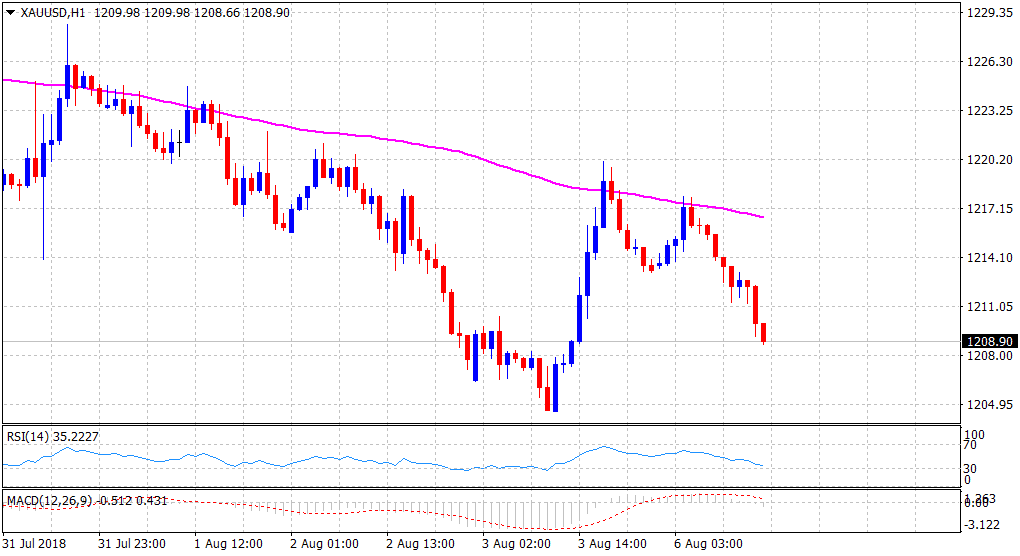
Spot Rate: $1208.90
Daily High: $1217.89
Trend: Bearish
Resistance
R1: $1218 (current day swing high)
R2: $1222 (horizontal zone)
R3: $1228 (July 31 swing high)
Support
S1: $1205 (17-month low set on Friday)
S2: $1200 (psychological round figure mark)
S3: $1195 (March 2017 low)
