- The yellow metal is under pressure as bears are attempting to revisit the current 2018 low at $1,204.10 a troy ounce. If they succeed the next level of support is likely seen near 1,194.30 March 10, 2017 low. On the flip side if bulls can support the market they will have to overcome the 1,211.17 and 1,213.70 resistances to the upside.
- Gold is attempting a double bottom with July 10, 2017, suggesting that the market migh be entering a consolidation phase in the near-term.
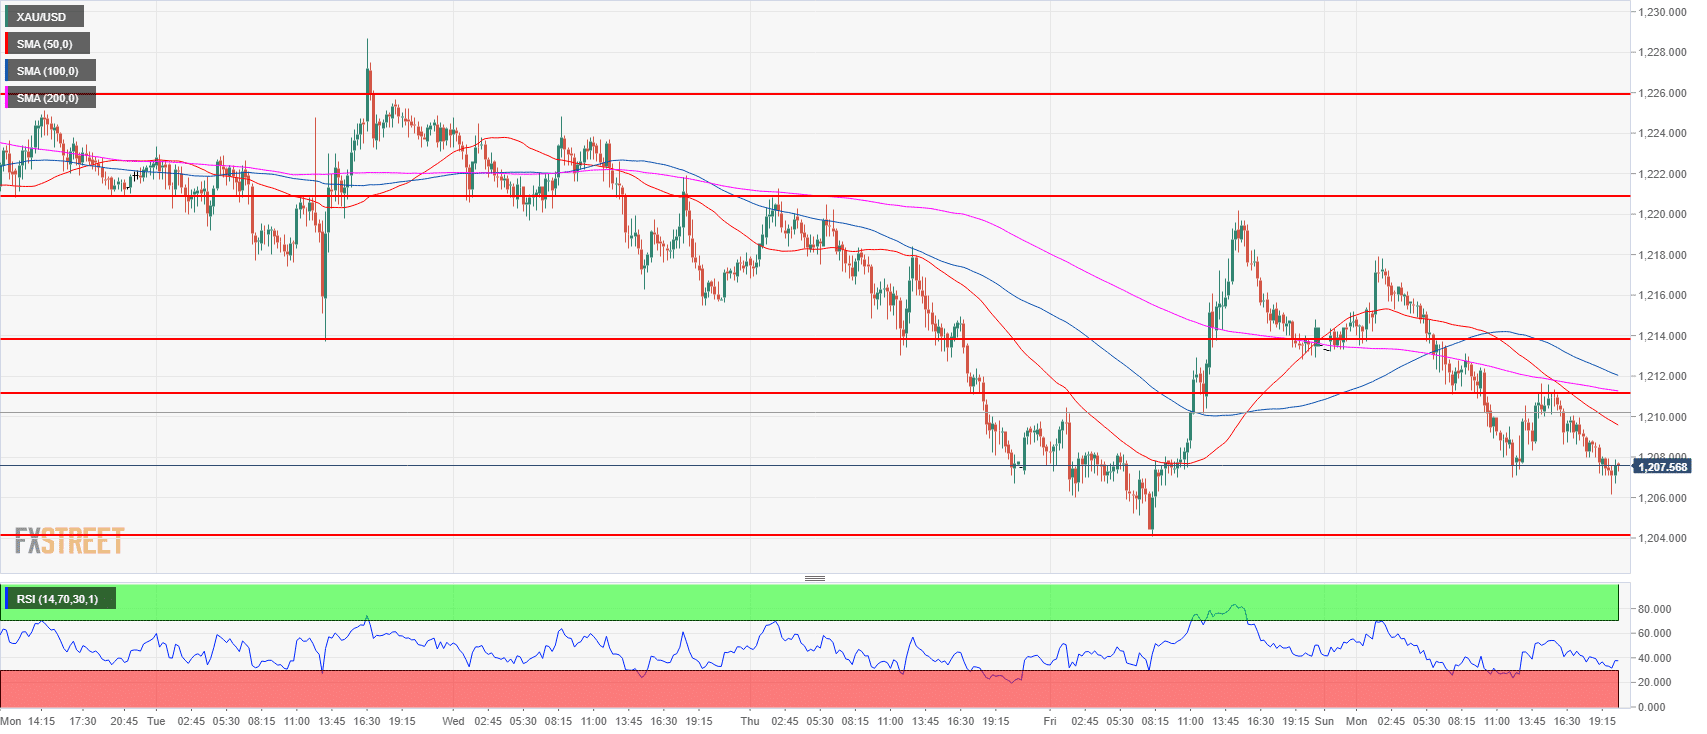
Gold daily chart
-636691843693446510.png)
Spot rate: 1,207.83
Relative change: -0.45%
High: 1,217.89
Low: 1,206.14
Trend: Bearish / Double bottom attempt with 1,204.00 July 10, 2017
Resistance 1: 1,211.17 July 19 low
Resistance 2: 1,213.70 July 31 low
Resistance 3: 1,220.90 July 18 low
Resistance 4: 1,223.00 consolidation area
Resistance 5: 1,225.90 July 17 low
Resistance 6: 1,232.00 consolidation area
Resistance 7: 1,236.28 July 13 low, key level
Resistance 8: 1,241.50 intraday swing low
Resistance 9: 1,245.65 June 28 low
Support 1: 1,204.00-1,204.10 July 10, 2017 swing low-2018 low
Support 2: 1,194.30 March 10, 2017 low
Support 3: 1,180.62 2017 January 27 low
