“¢ The pair eroded a major part of overnight gains to two-week tops and dropped to test 200-hour SMA during the early North-American session.
“¢ Technical indicators on the mentioned chart are holding firmly into bearish territory and thus, increase prospects for a follow-through selling.
“¢ A convincing break below the 0.9925-20 region, nearing 50% Fibonacci retracement level of the 0.9867-0.9985 recent up-move and last Friday’s swing low, will reinforce the bearish outlook.
USD/CHF 1-hourly chart
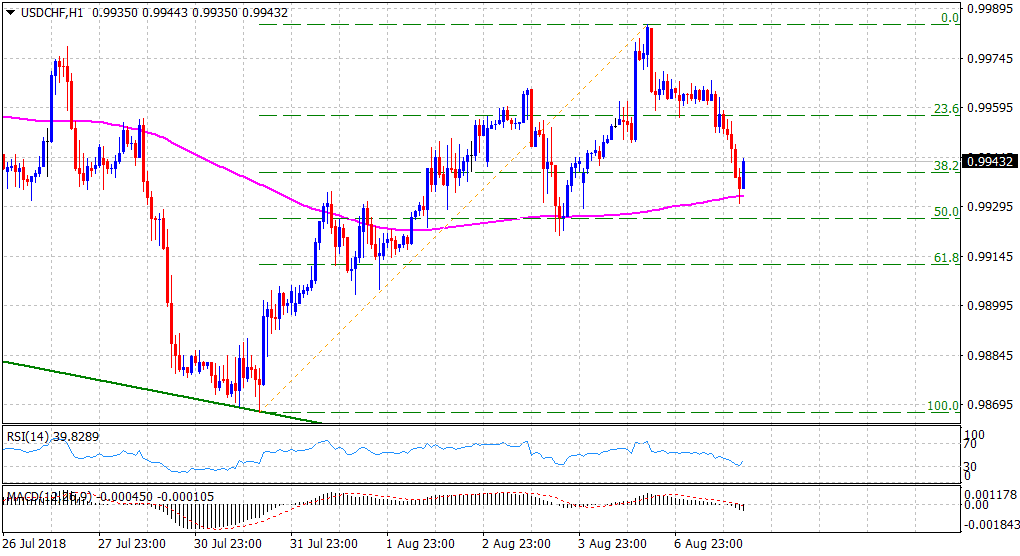
Spot Rate: 0.9943
Daily Low: 0.9931
Daily High: 0.9968
Trend: Bearish below 200-hour SMA
Resistance
R1: 0.9968 (current day swing high)
R2: 0.9994 (R1 daily pivot-point)
R3: 1.0025 (horizontal zone)
Support
S1: 0.9921 (last Friday’s swing low)
S2: 0.9900 (round figure mark)
S3: 0.9882 (S1 weekly pivot-point)
