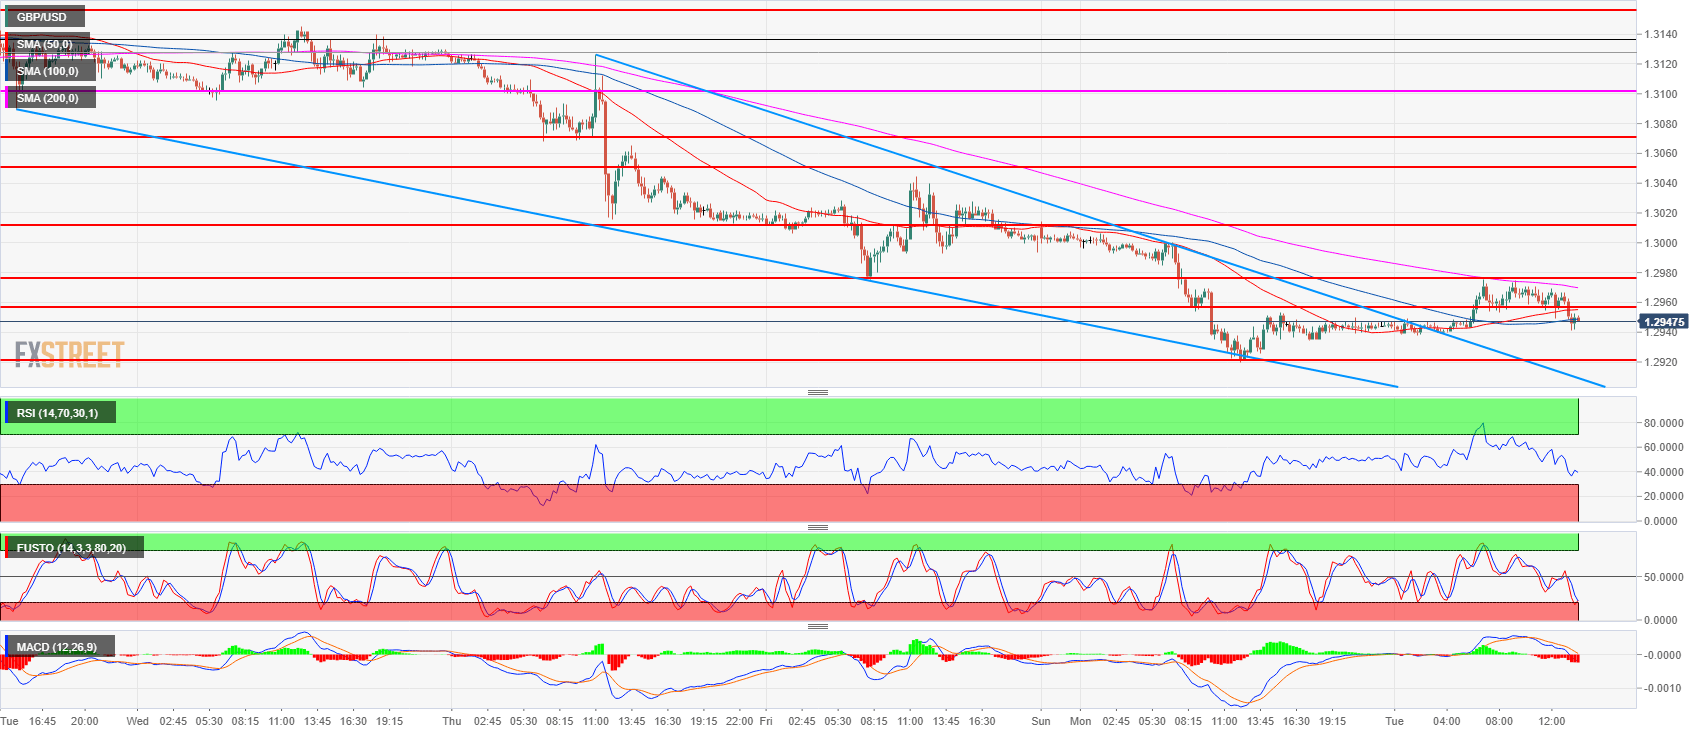
- GBP/USD found resistance at 1.2975, last Friday’s low, after which bears drove the market near the current daily low at 1.2937
- Bears would need a strong breakout below 1.2937 in order to open the gates to the 1.2920-1.2900 area.
- A failure to break below 1.2937 can lead to a rotation back up with bulls initially targeting the current daily high at 1.2975. A breakout above 1.2975 should lead to an acceleration towards 1.3000-1.3010 area.
GBP/USD daily chart
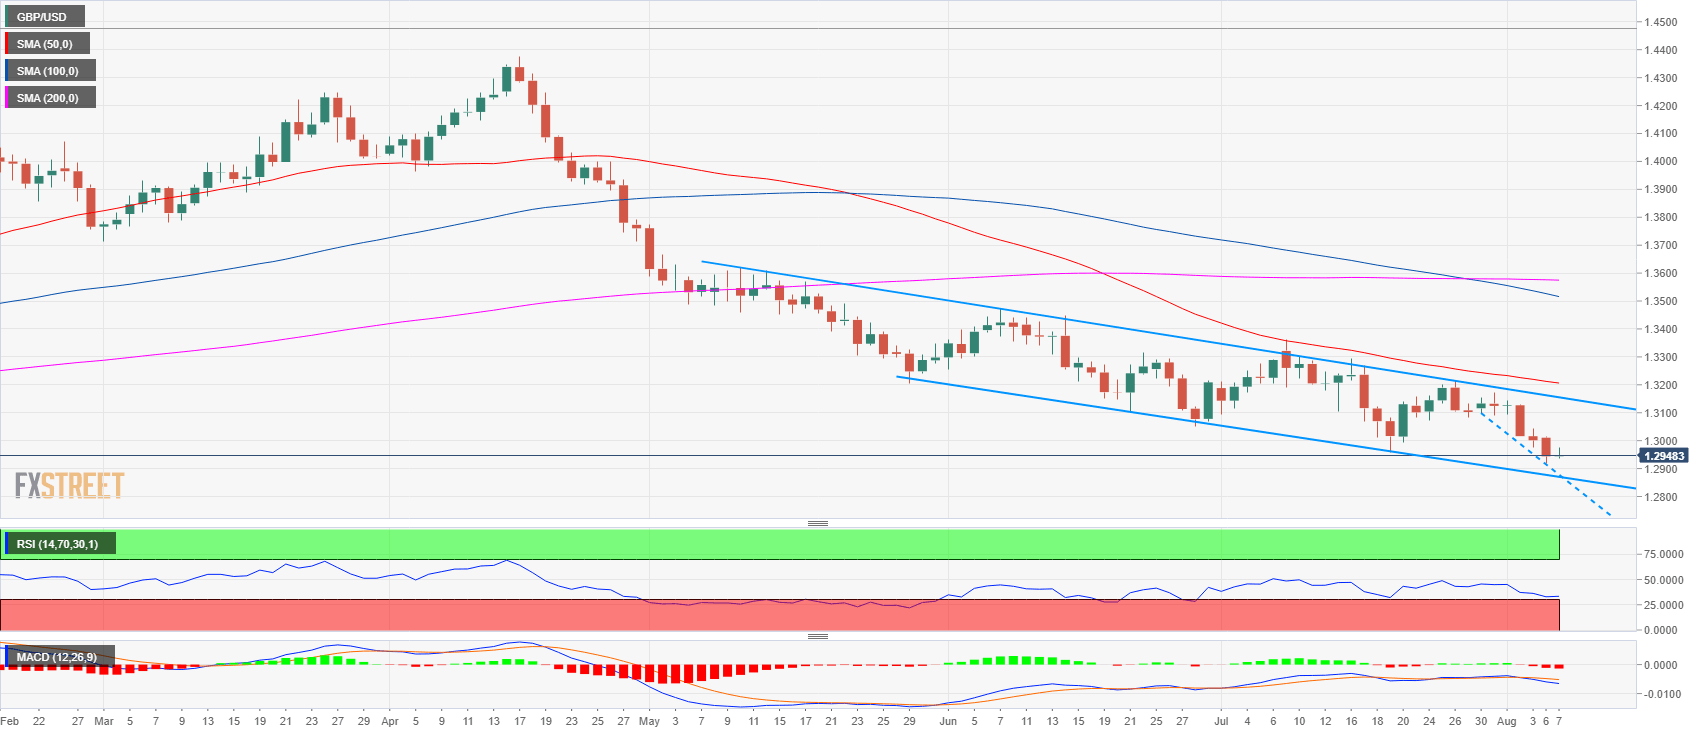
Spot rate: 1.2948
Relative change: 0.03%
High: 1.2975
Low: 1.2937
Trend: Bearish
Resistance 1: 1.2957 July 17 low
Resistance 2: 1.2975 August 3 low
Resistance 3: 1.3000-1.3010 area, figure and July 18 low
Resistance 4: 1.3049 June 28 low
Resistance 5: 1.3100-1.3076 area, figure and July 24 low
Resistance 6: 1.3155 former breakout point
Resistance 7: 1.3200 figure
Resistance 8: 1.3230 supply level
Resistance 9: 1.3250 June 4 high
Support 1: 1.2920 -1.2900 area, current 2018 low and figure
Support 2: 1.2852 August 31, 2017 low
Support 3: 1.2800 figure
