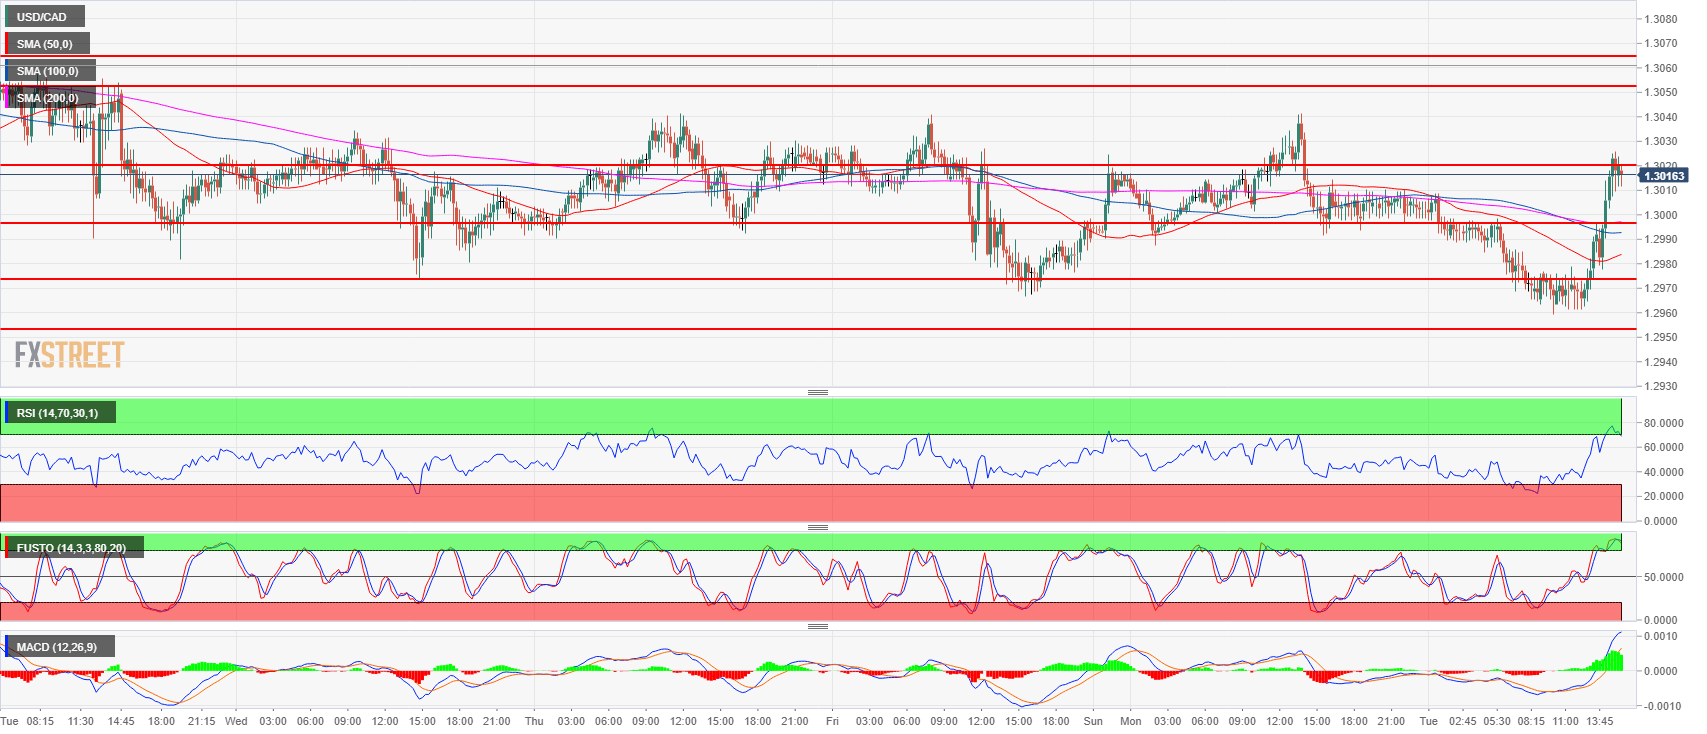
- USD/CAD found support near the 1.2960 level in early Europe and then bull lifted the currency pair back above the 1.3000.
- USD/CAD has found support at the daily 100-period simple moving average but as the market has been extremely two-sided in the past weeks, the bearish correction remains in place.
- A breakout above 1.3120-1.3155 would likely be the end of the bearish correction and the resumption of the bear trend while a breakout below 1.2950 would likely open the door to more losses towards 1.2855 June 6 low.
USD/CAD 15-minute chart
USD/CAD daily chart
-636692533626274309.png)
Spot rate: 1.3017
Relative change: 0.10%
High: 1.3026
Low: 1.2959
Trend: Bullish / Bearish correction
Resistance 1: 1.3022 July 25 low
Resistance 2: 1.3053-1.3066 area, June 5 swing high and July 9 low
Resistance 3: 1.3100-1.3120 figure and supply/demand level
Resistance 4: 1.3155 June 18 low
Resistance 5: 1.3200 figure
Resistance 6: 1.3271 June 29 high
Resistance 7: 1.3350 figure
Resistance 8: 1.3388, 2018 high
Resistance 9: 1.3543 June 9, 2017 swing high
Support 1: 1.3000 figure
Support 2: 1.2974 August 1 low
Support 3: 1.2900 figure
Support 4: 1.2855 June 6 low
