Home GBP/JPY Technical Analysis: Slide continues as pair hovers around key 144.00 area
FXStreet News

GBP/JPY Technical Analysis: Slide continues as pair hovers around key 144.00 area

  • The main trend continues to point to the downside, but the negative momentum eased as price hit a key support area.  
  • The pair traded under 144.00 but never posted a daily close below. So a close significantly under that level could open the doors for a test of 2018 lows and to a slide to 142.50, the next strong support.  
  • A rebound could extend to 145.25 the next resistance. Above, relevant levels are 146.50 (21-day SMA) and the 148.20 influence area (downtrend line).  
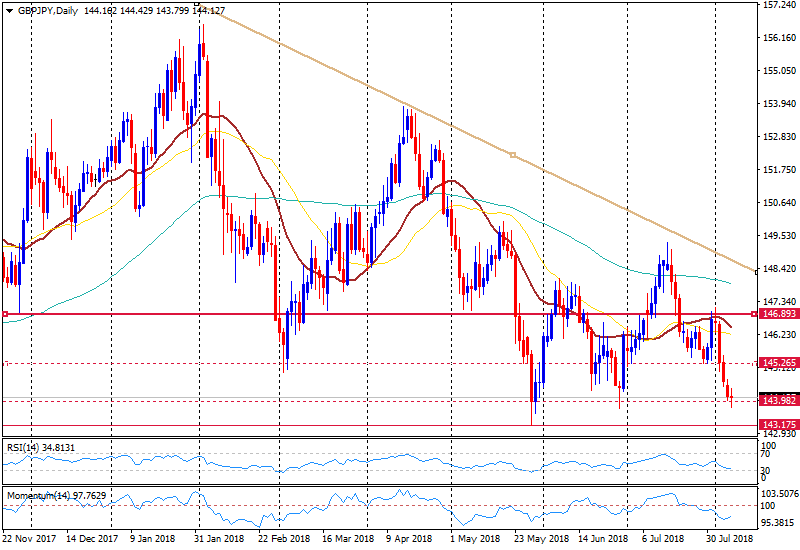
GBP/JPY Daily chart

GBP/JPY
Spot rate:                   144.10
High:                         144.42
Low:                          143.79

Trend:                        Bearish

Resistance 1:            145.20 (Jul 27 & 30 low).  
Resistance 2:            146.00
Resistance 3:            146.50

Support 1:                143.75 (Jun & Aug low)
Support 2:                143.15/20 (May low)
Support 3:                142.50
 

FX Street

FX Street

FXStreet is the leading independent portal dedicated to the Foreign Exchange (Forex) market. It was launched in 2000 and the portal has always been proud of their unyielding commitment to provide objective and unbiased information, to enable their users to take better and more confident decisions.