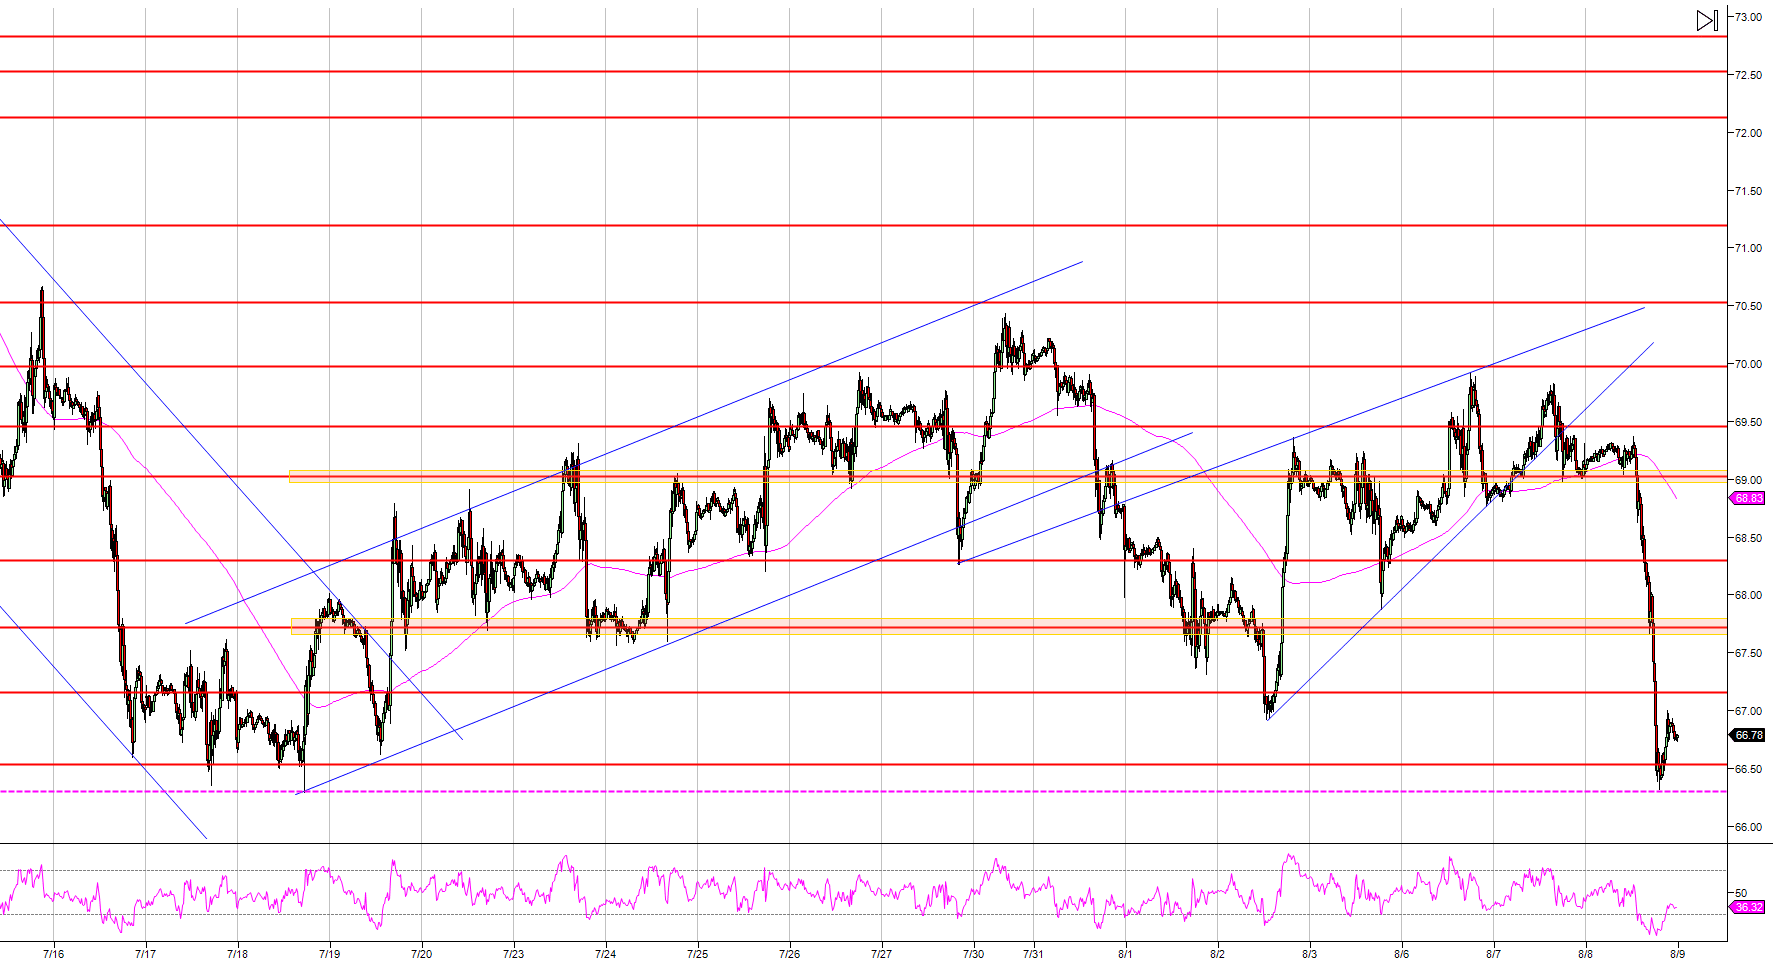
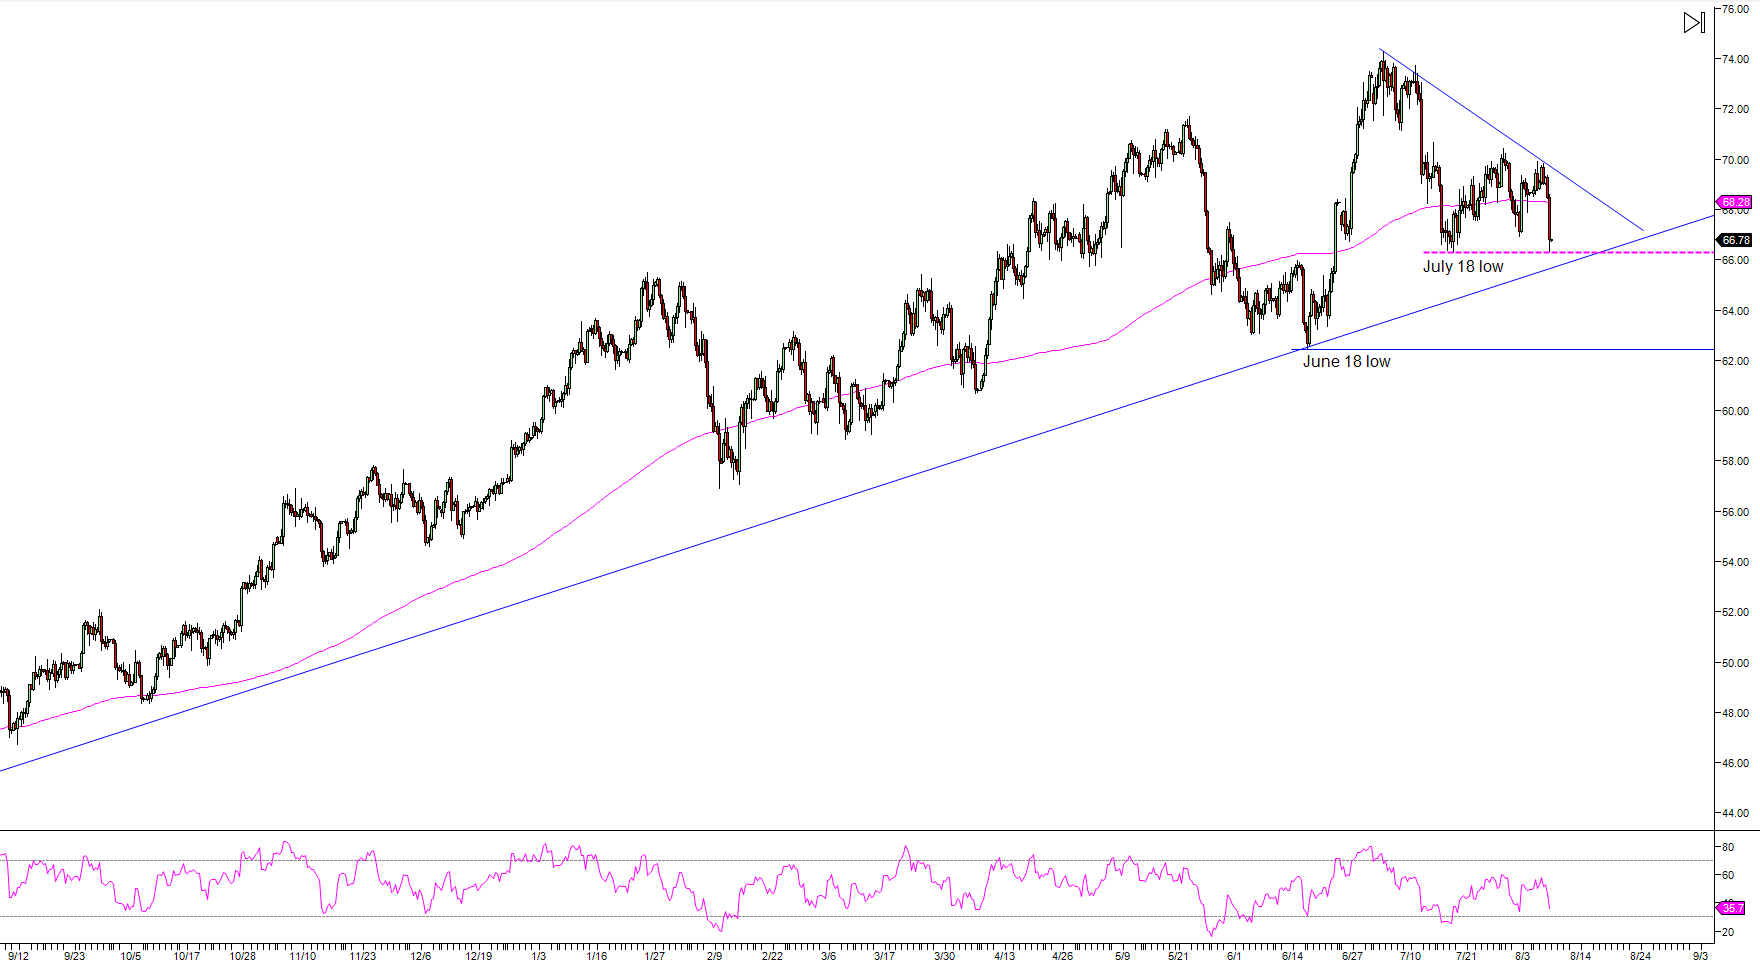
- Crude oil melted about $2.5 this Wednesday as it broke below the $67.00 psychological level and the swing low at $66.92 a barrel. This is the worst daily decline since July 16.
- Bears objective is to breakout below 66.30, July 18 low in order to open the gates towards June 18 low at 62.74.
- Crude oil bulls objective is to create a double bottom with July 18 low at 66.30. While in the short-term bulls have a fair chance to support the market, it remains to be seen how long they can sustain it. As of now, the overall picture suggests that a break below 66.30 is virtually bound to happen at some point.
Crude oil 480-minute chart
Spot rate: 66.69
Relative change: -3.53%
High: 69.34
Low: 66.29
Main Trend: Bullish
Short-term: Bearish reversal below 66.30
Resistance 1: 67.16 June 14 high
Resistance 2: 67.16 June 14 high
Resistance 3: 67.72 June 26 low
Resistance 4: 68.30 supply/demand level
Resistance 5: 69.00 figure
Resistance 6: 69.44 June 25 high
Resistance 7: 70.00 figure
Resistance 8: 70.53 May 24 low
Resistance 9: 71.19 May 23 low
Resistance 10: 72.13 July 6 low
Resistance 11: 73.00 figure
Support 1: 66.30-66.53 July 18 swing low and June 20 high
Support 2: 65.71, June 22 low
Support 3: 65.00 figure
