- EUR/GBP reached a new 2018 high at 0.9032 this Thursday then the market pulled back to the 200-period simple moving average just below the 0.9000 mark.
- EUR/GBP seems to have found some support above 0.8957/67 area. Bulls objective is to resume the bull trend in order to reach 0.9109 September 8, 2017 low.
- An extension of the pullback would lead EUR/GBP towards 0.8937 July 31 high.
EUR/GBP 15-minute chart
-636694321637946908.png)
EUR/GBP daily chart
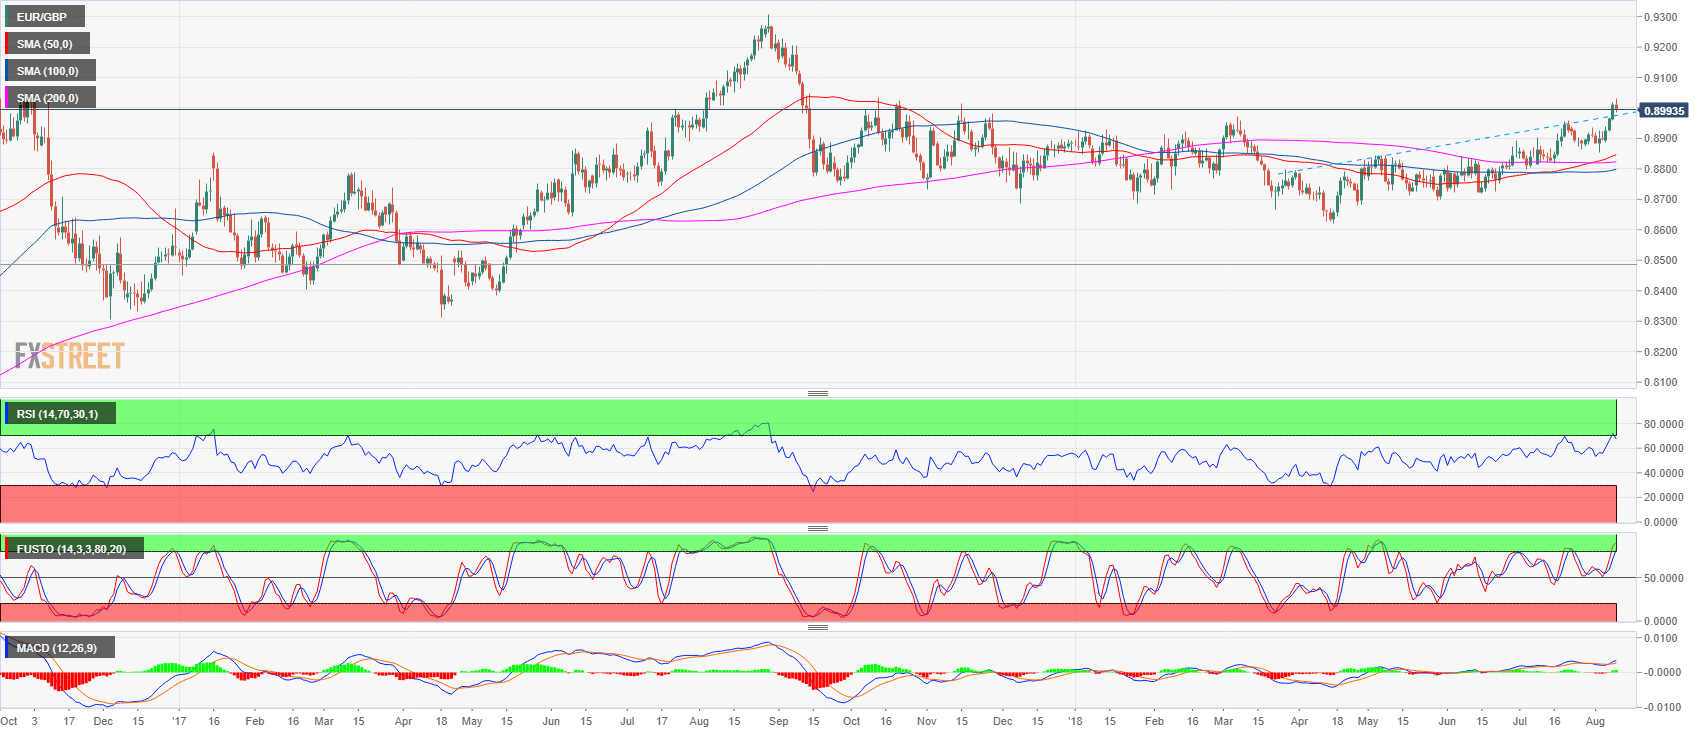
Spot rate: 0.8992
Relative change: -0.21%
High: 0.9032
Low: 0.8984
Trend: Bullish
Resistance 1: 0.9019 August 9 high
Resistance 2: 0.9109 September 8, 2017 low
Resistance 3: 0.9160 August 23, 2017 low
Support 1: 0.8957/67 area, July 20 high and March 7 high
Support 2: 0.8937 July 31 high
Support 3: 0.8920 supply level
Support 4: 0.8900 July 9 high
Support 5: 0.8868, 13 July high
Support 6: 0.8840 supply level
Support 7: 0.8820-0.8840 area, 200-day SMA
Support 8: 0.8800 figure
Support 9: 0.8780 daily 50-period SMA
Support 10: 0.8764 June 8 low
