- Sterling staggering into 12-month lows as the broader market bids up the Greenback to cap off the trading week.
- UK GDP, US CPI data still sitting heavy in the barrel, Friday’s volatility isn’t done yet.
- A surge of buying in the US Dollar sees the Cable heading through Friday with a notable bias towards the downside.
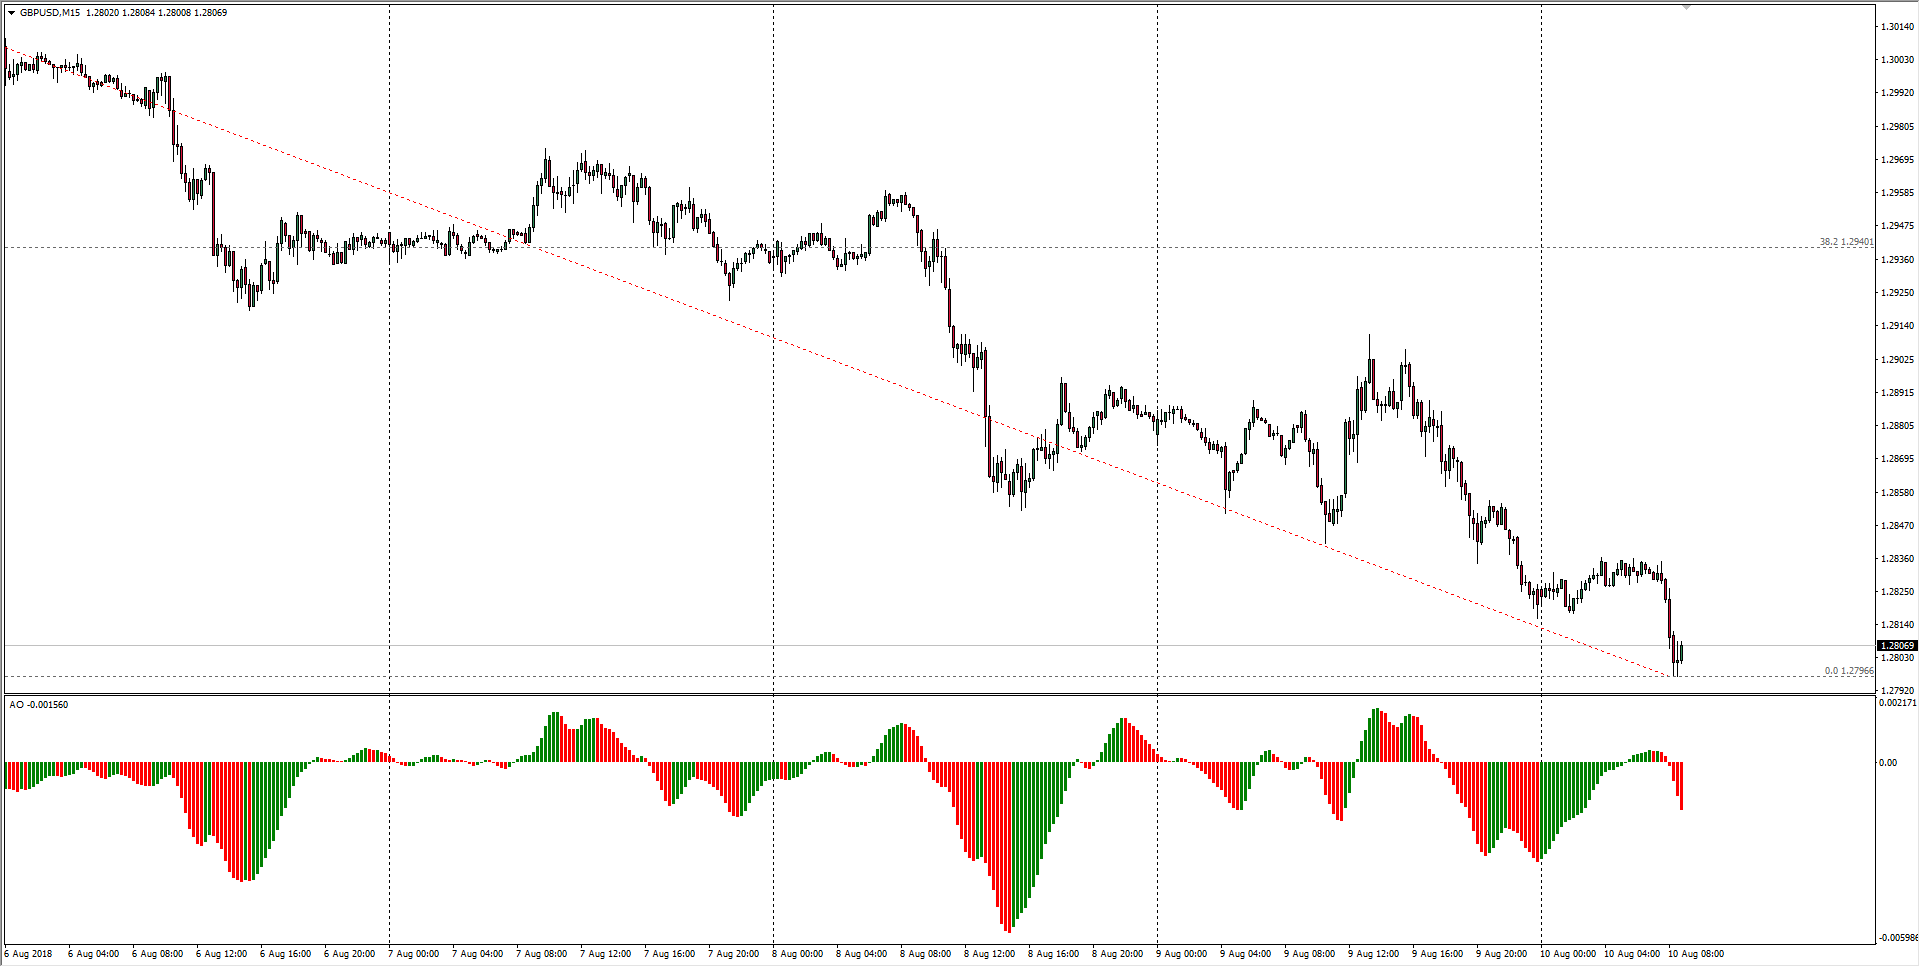
| Spot rate: | 1.2806 |
| Relative change: | -0.14% |
| High: | 1.2836 |
| Low: | 1.2796 |
| Trend: | Bearish |
| Support 1: | 1.2796 (current low) |
| Support 2: | 1.2759 (S2 daily pivot) |
| Support 3: | 1.2588 (June 2017 low) |
| Resistance 1: | 1.2836 (current day high) |
| Resistance 2: | 1.3028 (61.8% Fibo retracement level) |
| Resistance 3: | 1.31752 (previous week high) |
