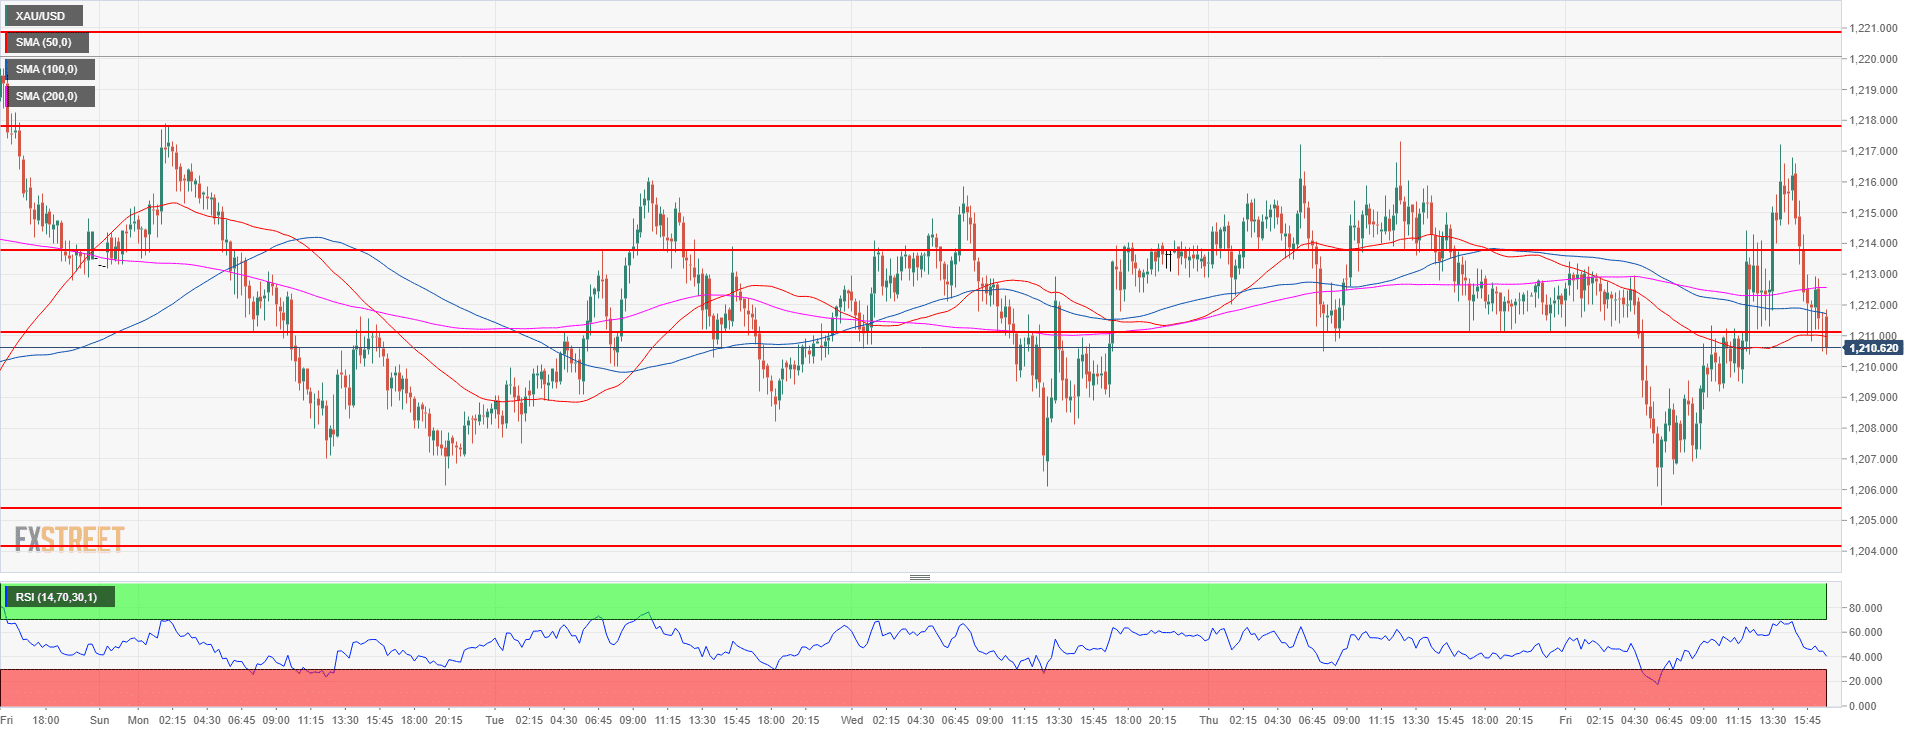
- Gold spent the week oscillating between the 1,206 support and 1,217.00 resistance.
- Gold is debating whether to resume the bear trend below 1,204.10, the 2018 low, or create a bullish reversal by breaking above 1,217.89-1,220.90 area.
- A breakout above 1,217.89-1,220.90 area can lead to an acceleration towards 1,236.28 July 13 low, key level.
Gold daily chart
-636695178091128683.png)
Spot rate: 1,211.40
Relative change: -0.07%
High: 1,217.20
Low: 1,205.50
Trend: Bearish / Double bottom attempt with 1,204.00 July 10, 2017
Resistance 1: 1,213.70 July 31 low
Resistance 2: 1,217.89-1,220.90 area, August 6 high and July 18 low
Resistance 3: 1,223.00 consolidation area
Resistance 4: 1,225.90 July 17 low
Resistance 5: 1,232.00 consolidation area
Resistance 6: 1,236.28 July 13 low, key level
Resistance 7: 1,241.50 intraday swing low
Resistance 8: 1,245.65 June 28 low
Support 1: 1,211.17 July 19 low
Support 2: 1,205.50-1,204.10 area, August 10 low and 2018 low
Support 3: 1,194.30 March 10, 2017 low
Support 4: 1,180.62 2017 January 27 low
