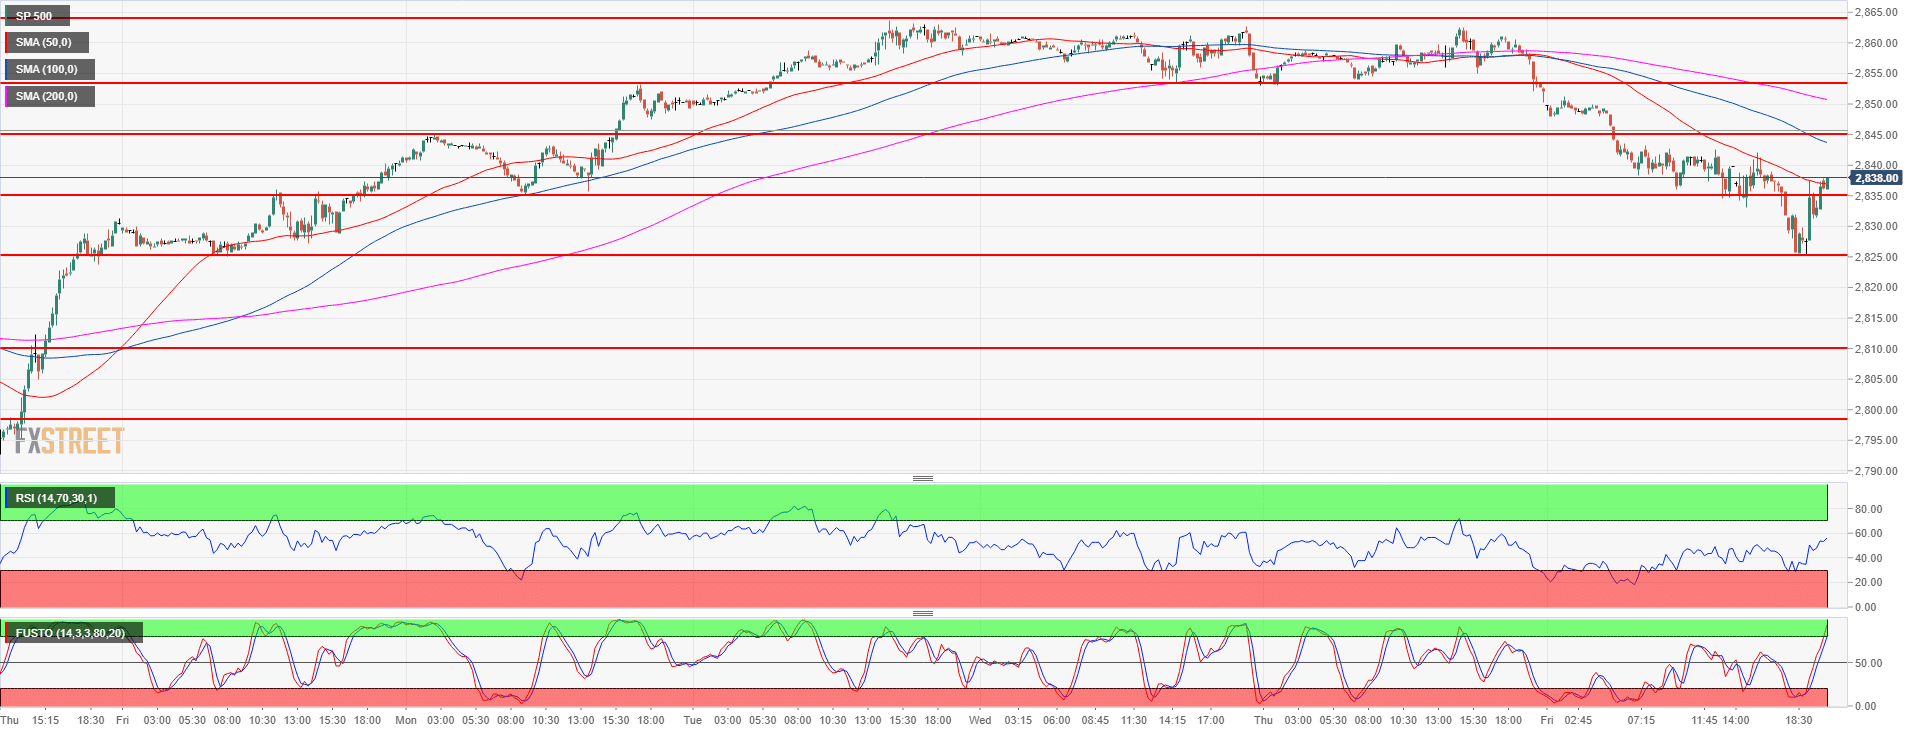
- The S&P500 declined as far as the 2,825.00 support on the last day of the week.
- Bulls managed to bring the market back above the 2,835.25 level suggesting that they might try to retake the current weekly high in the next sessions.
- Next week bears objective will be to break below 2,825.00 support in order to target 2,810.00 demand level. Resistances become the 2,845.00 supply/demand level and 2,853.00 August 9 low.
S&P500 15-minute chart
S&P500 daily chart
-636695317296112996.png)
Spot rate: 2,838.50
Relative change: -0.47%
High: 2,851.25
Low: 2,825.25
Trend: Bullish / Bearish reversal attempt below 2,852.00
Resistance 1: 2,845.00 supply/demand level
Resistance 2: 2,853.00 August 9 low
Resistance 3: 2,863.75 August 7 high
Resistance 4: 2,875.50 all-time-high
Resistance 5: 2,900 figure
Support 1: 2,825.00 August 3 low
Support 2: 2,810.00 demand level
Support 3: 2,798.50 July 30 low
