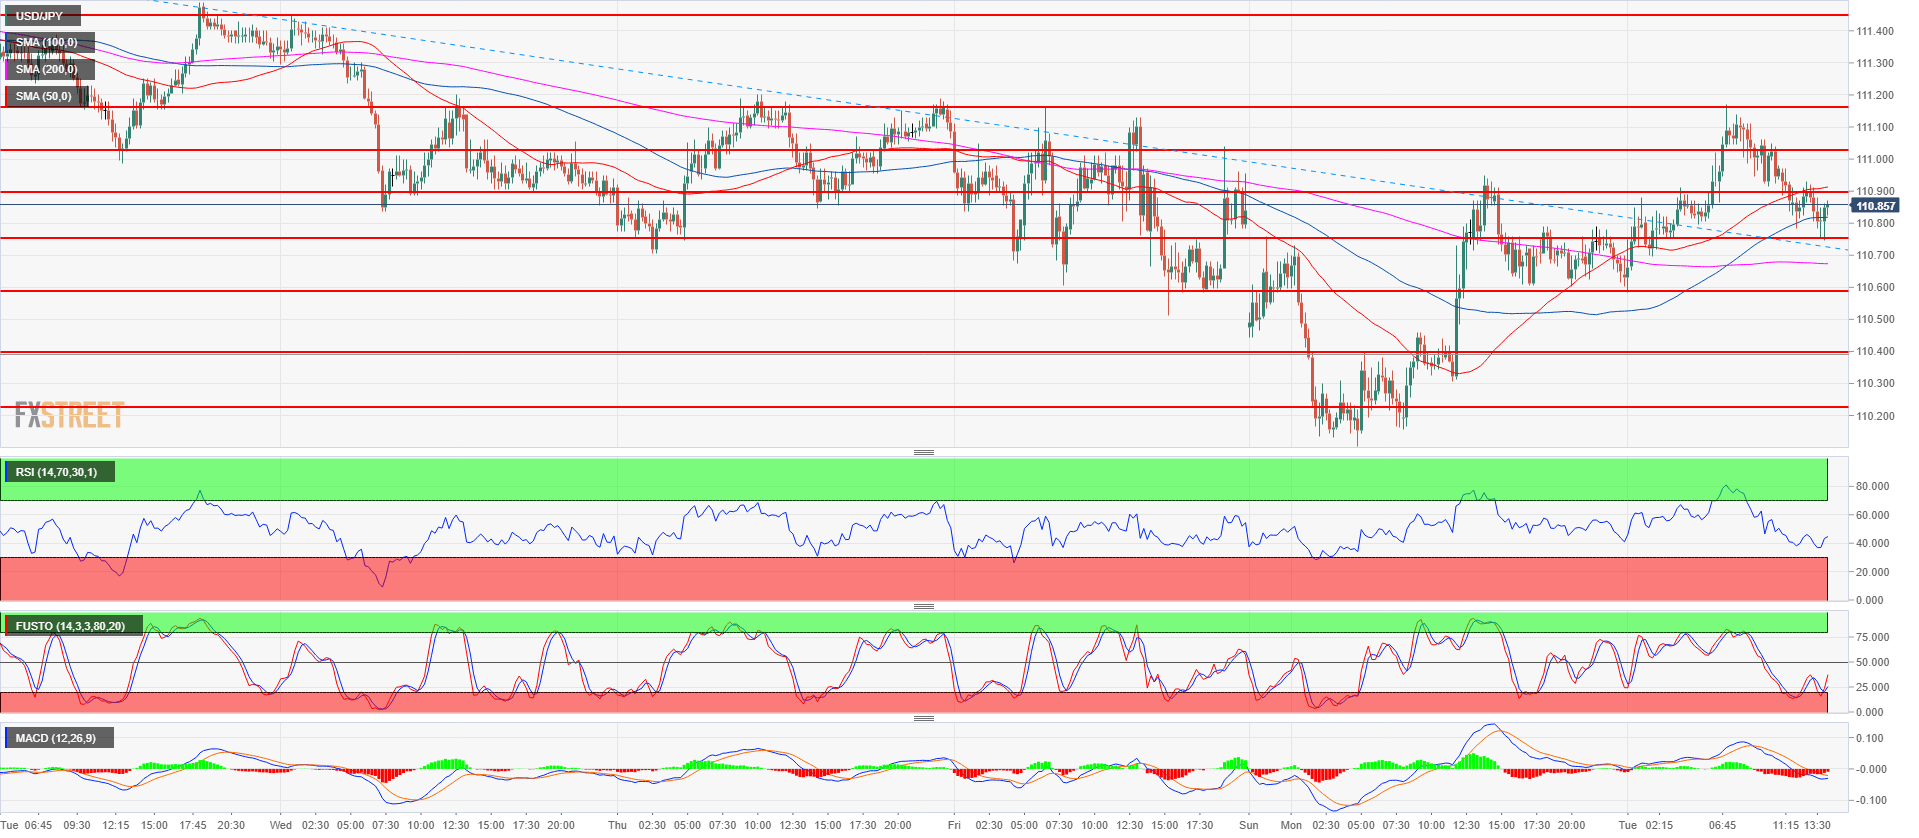
- Earlier in the day, USD/JPY found resistance at the 111.16 resistance. USD/JPY bulls are now trying to find support at the 110.75 support above the 200-period simple moving average on the 15-minute chart.
- If bulls are successful the next upside target is a retest of the 111.16 resistance. A break of the level should open the gate to a strong breakout to 111.45 August 8 high.
- On the flip side, if bulls are unable to keep prices above 110.75, the next scaling point is seen at 110.58.
USD/JPY 15-minute chart
USD/JPY daily chart
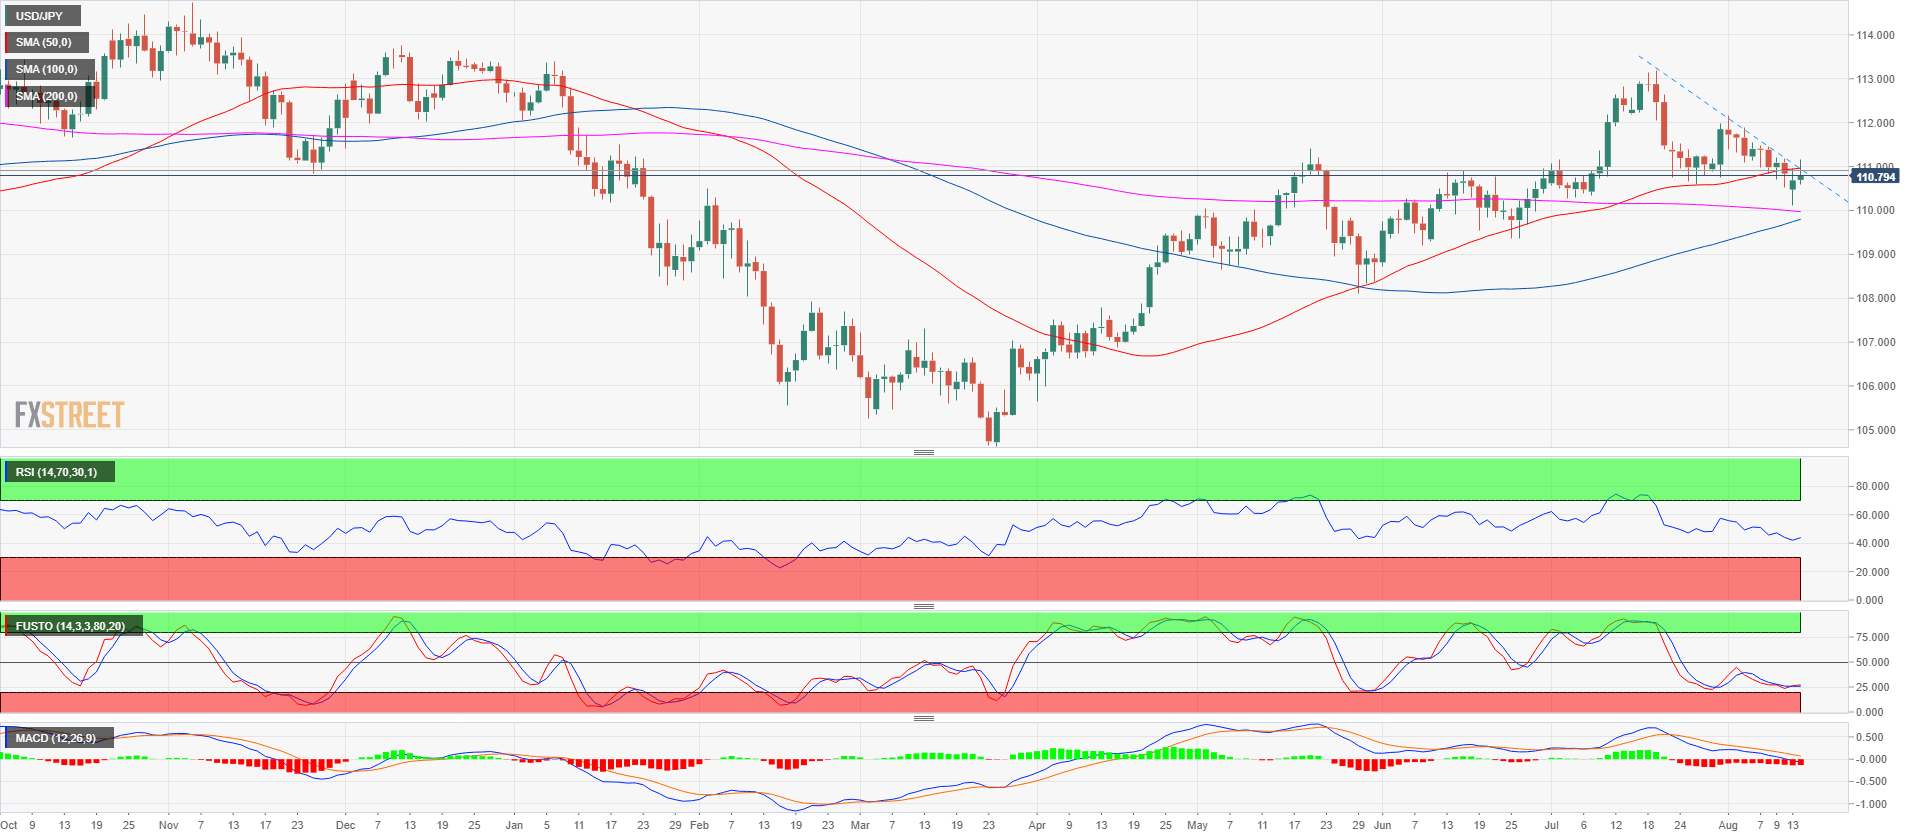
Spot rate: 110.79
Relative change: 0.01%
High: 111.17
Low: 110.58
Trend: Bullish
Resistance 1: 110.90 June 15 swing high
Resistance 2: 111.02-111.16 area, figure and current August 6 low
Resistance 3: 111.45 August 8 high
Resistance 4: 111.54-111.64 area, August 6, high and supply/demand level
Resistance 5: 111.82-112.00 area, supply level and figure
Resistance 6: 112.19-112.40 area, July 11 high and intraday swing low
Resistance 7: 112.64 July 12 high
Resistance 8: 113.18, 2018 high
Resistance 9: 113.26-113.38, 200-weekly simple moving average and January 8 high
Resistance 10: 114.45 October 27, 2017 high
Support 1: 110.75, July 23 low
Support 2: 110.58 July 26 swing low
Support 3: 110.40 demand level
Support 4: 110.27 July 4 low
