- USD/CAD is trading just below a daily trendline which is acting as resistance for the main bullish trend to resume.
- USD/CAD bulls are also having a hard time due to the 1.3120-1.3155 area which is acting as strong resistance level for the last weeks of trading. Until the market cannot have a sustained breakout above the area, the short-term momentum is bearish with targets at 1.3100 figure and 1.3053-1.3066 area.
- A bull breakout above 1.3200 would negate the bearish short-term scenario.
USD/CAD 15-minute chart
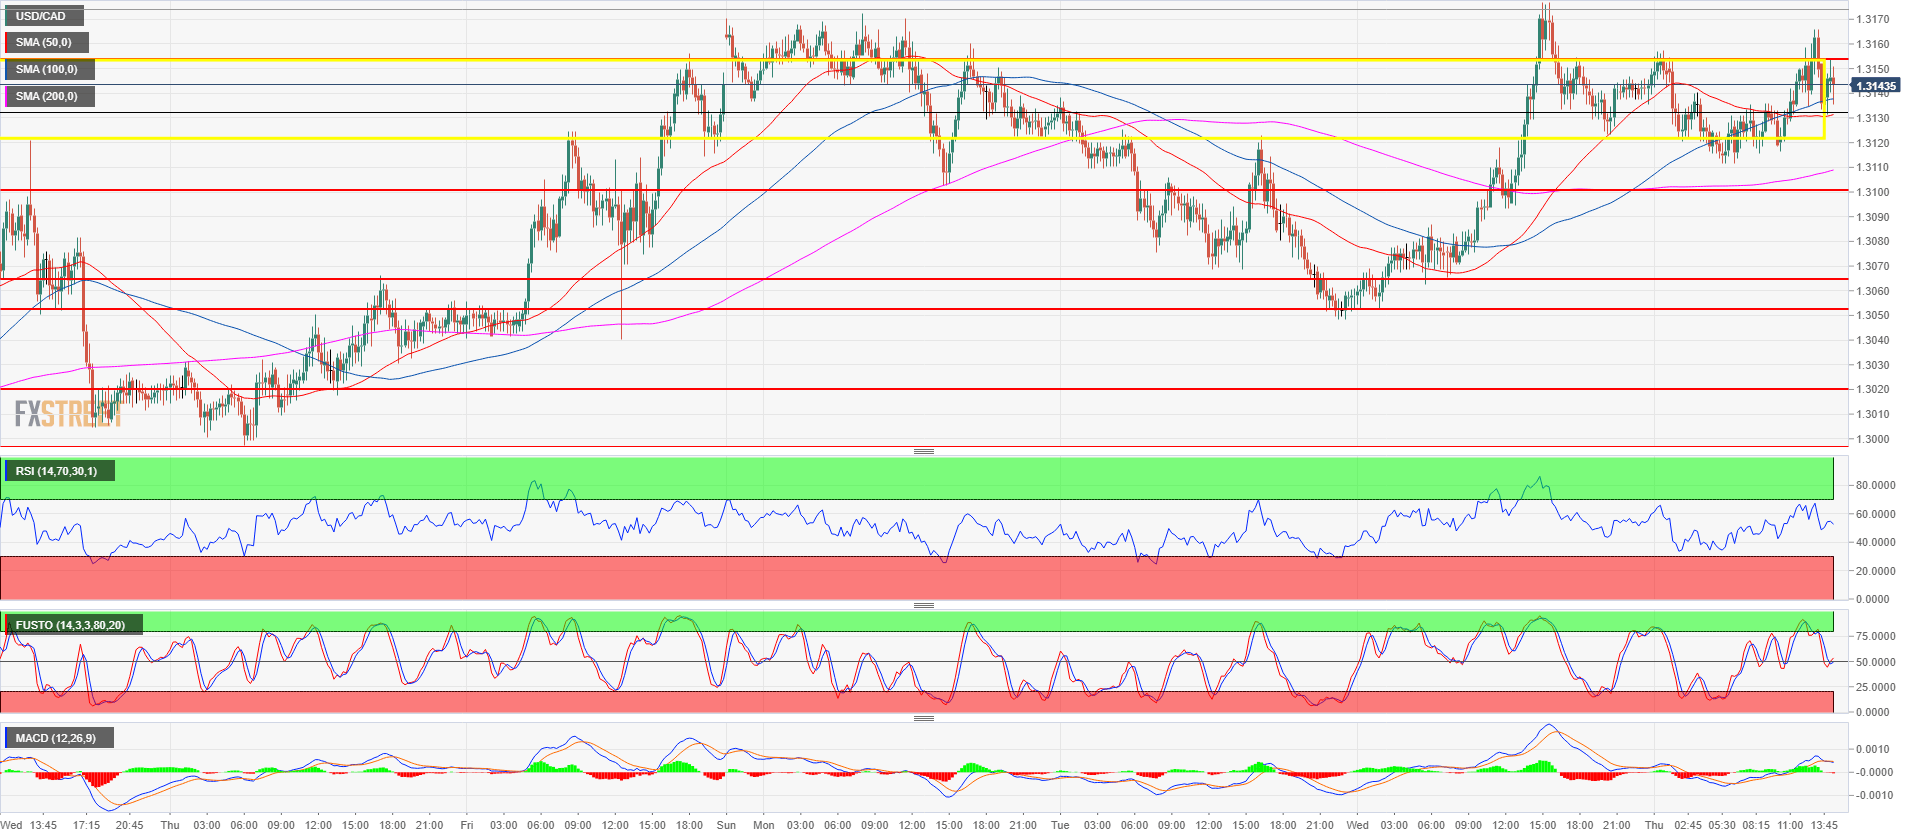
Spot rate: 1.3142
Relative change: 0.00%
High: 1.3166
Low: 1.3111
Trend: Bullish
Short-term Trend: Bearish below 1.3200
Resistance 1: 1.3120-1.3155 area, supply/demand level and June 18 low
Resistance 2: 1.3172 August 13 swing high
Resistance 3: 1.3200 figure
Resistance 4: 1.3271 June 29 high
Resistance 5: 1.3350 figure
Resistance 6: 1.3388, 2018 high
Resistance 7: 1.3543 June 9, 2017 swing high
Support 1: 1.3100 figure
Support 2: 1.3053-1.3066 area, June 5 swing high and July 9 low
Support 3: 1.3022 July 25 low
Support 4: 1.3000 figure
Support 5: 1.2974 August 1 swing low
Support 6: 1.2900 figure
Support 7: 1.2855 June 6 low
