- The USD/TRY hourly chart shows a falling wedge breakout – a bullish pattern – which indicates the pullback from the recent high of 7.08 has ended and the bulls are back in a commanding position.
- The 10-day MA continues to rise in a bull-friendly manner.
- The stacking order of the major MAs (50-day above 100-day above 200-day) indicates long-term bull bias.
- The path of least resistance remains to the upside and 6.6-6.8 could be put to test again if prices find acceptance above the immediate hurdle of 6.35.
Hourly chart
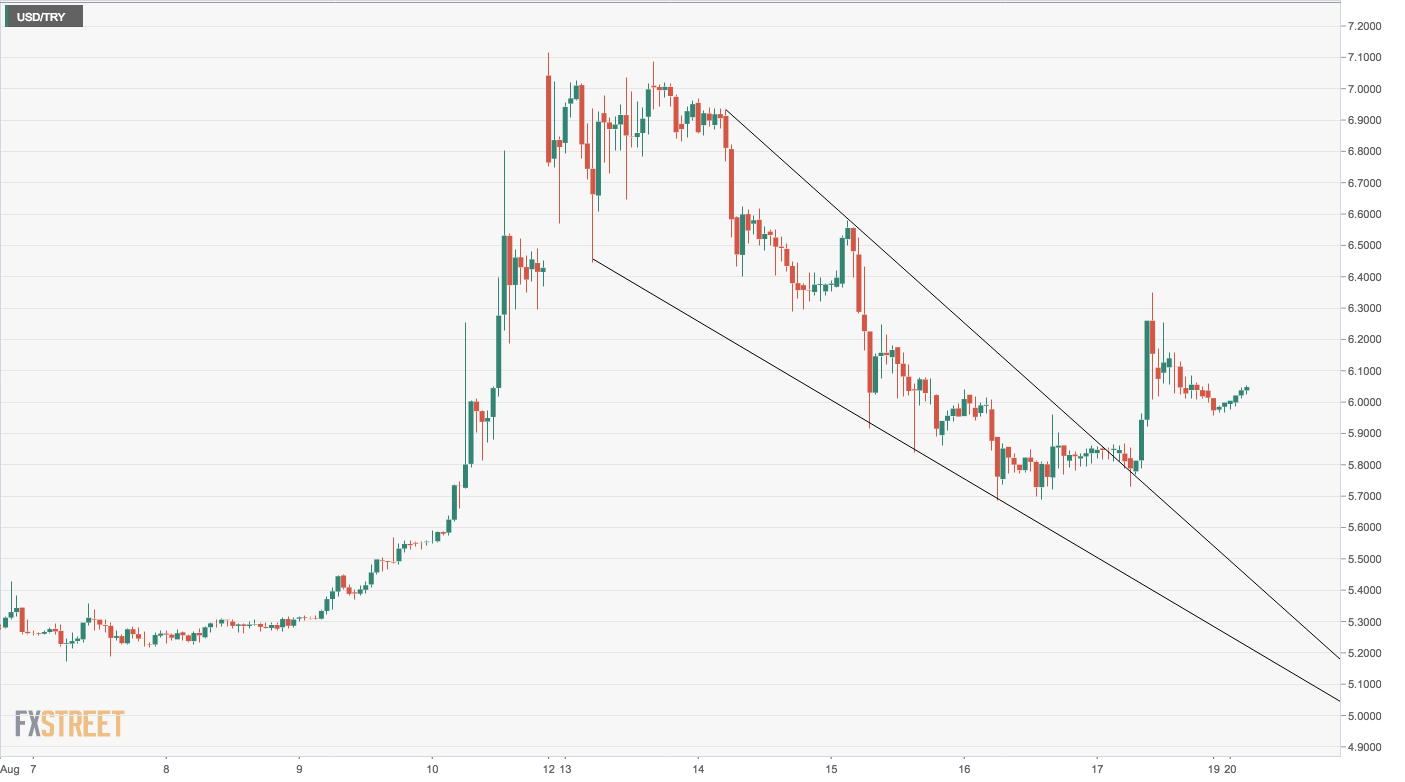
Spot Rate: 6.04
Daily High: 6.0483
Daily Low: 5.9615
Trend: Bullish
R1: 6.1328 (100-hour MA)
R2: 6.35 (hourly chart hurdle)
R3: 7.00 (psychological hurdle)
Support
S1: 5.92 (50-hour MA)
S2: 5.74 (support as per the hourly chart)
S3: 5.69 (Aug. 16 low)
