“¢ Bullish traders showed some resilience below the key 110.00 psychological mark, with the pair managing to recover early lost ground to near two-month lows.
“¢ A cluster of important moving averages (100 & 200-day) and 38.2% Fibonacci retracement level extended some support and helped stall the recent downfall.
“¢ Stay above the mentioned confluence region is likely to support an intraday bullish bias, while a sustained move below will shift the bias to bearish.
USD/JPY daily chart
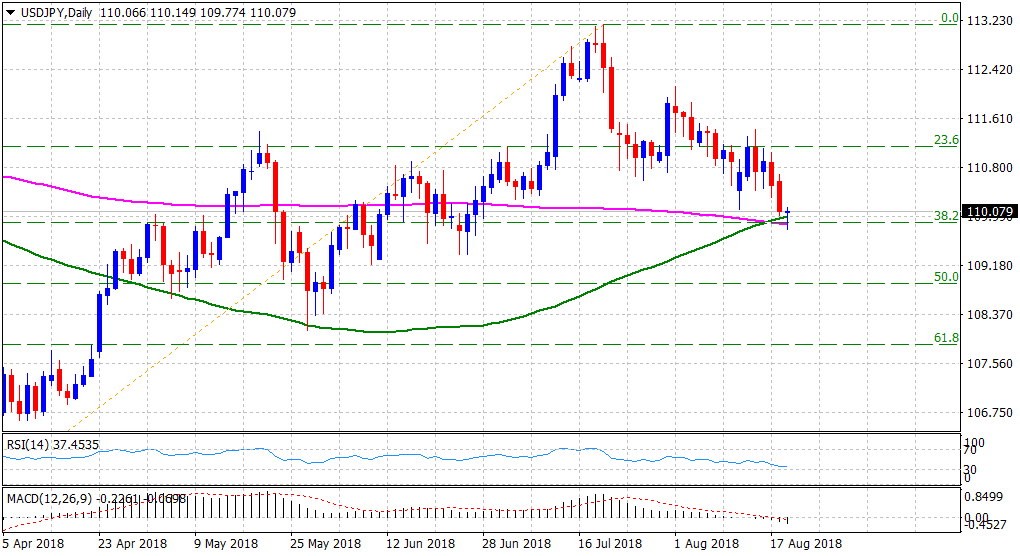
Spot Rate: 110.08
Daily Low: 109.77
Trend: Neutral
Resistance
R1: 110.51 (R1 daily pivot-point)
R2: 110.68 (overnight swing high)
R3: 110.90 (horizontal zone)
Support
S1: 109.77 (current day swing low)
S2: 109.58 (S2 daily pivot-point)
S3: 109.37 (late-June swing low)
