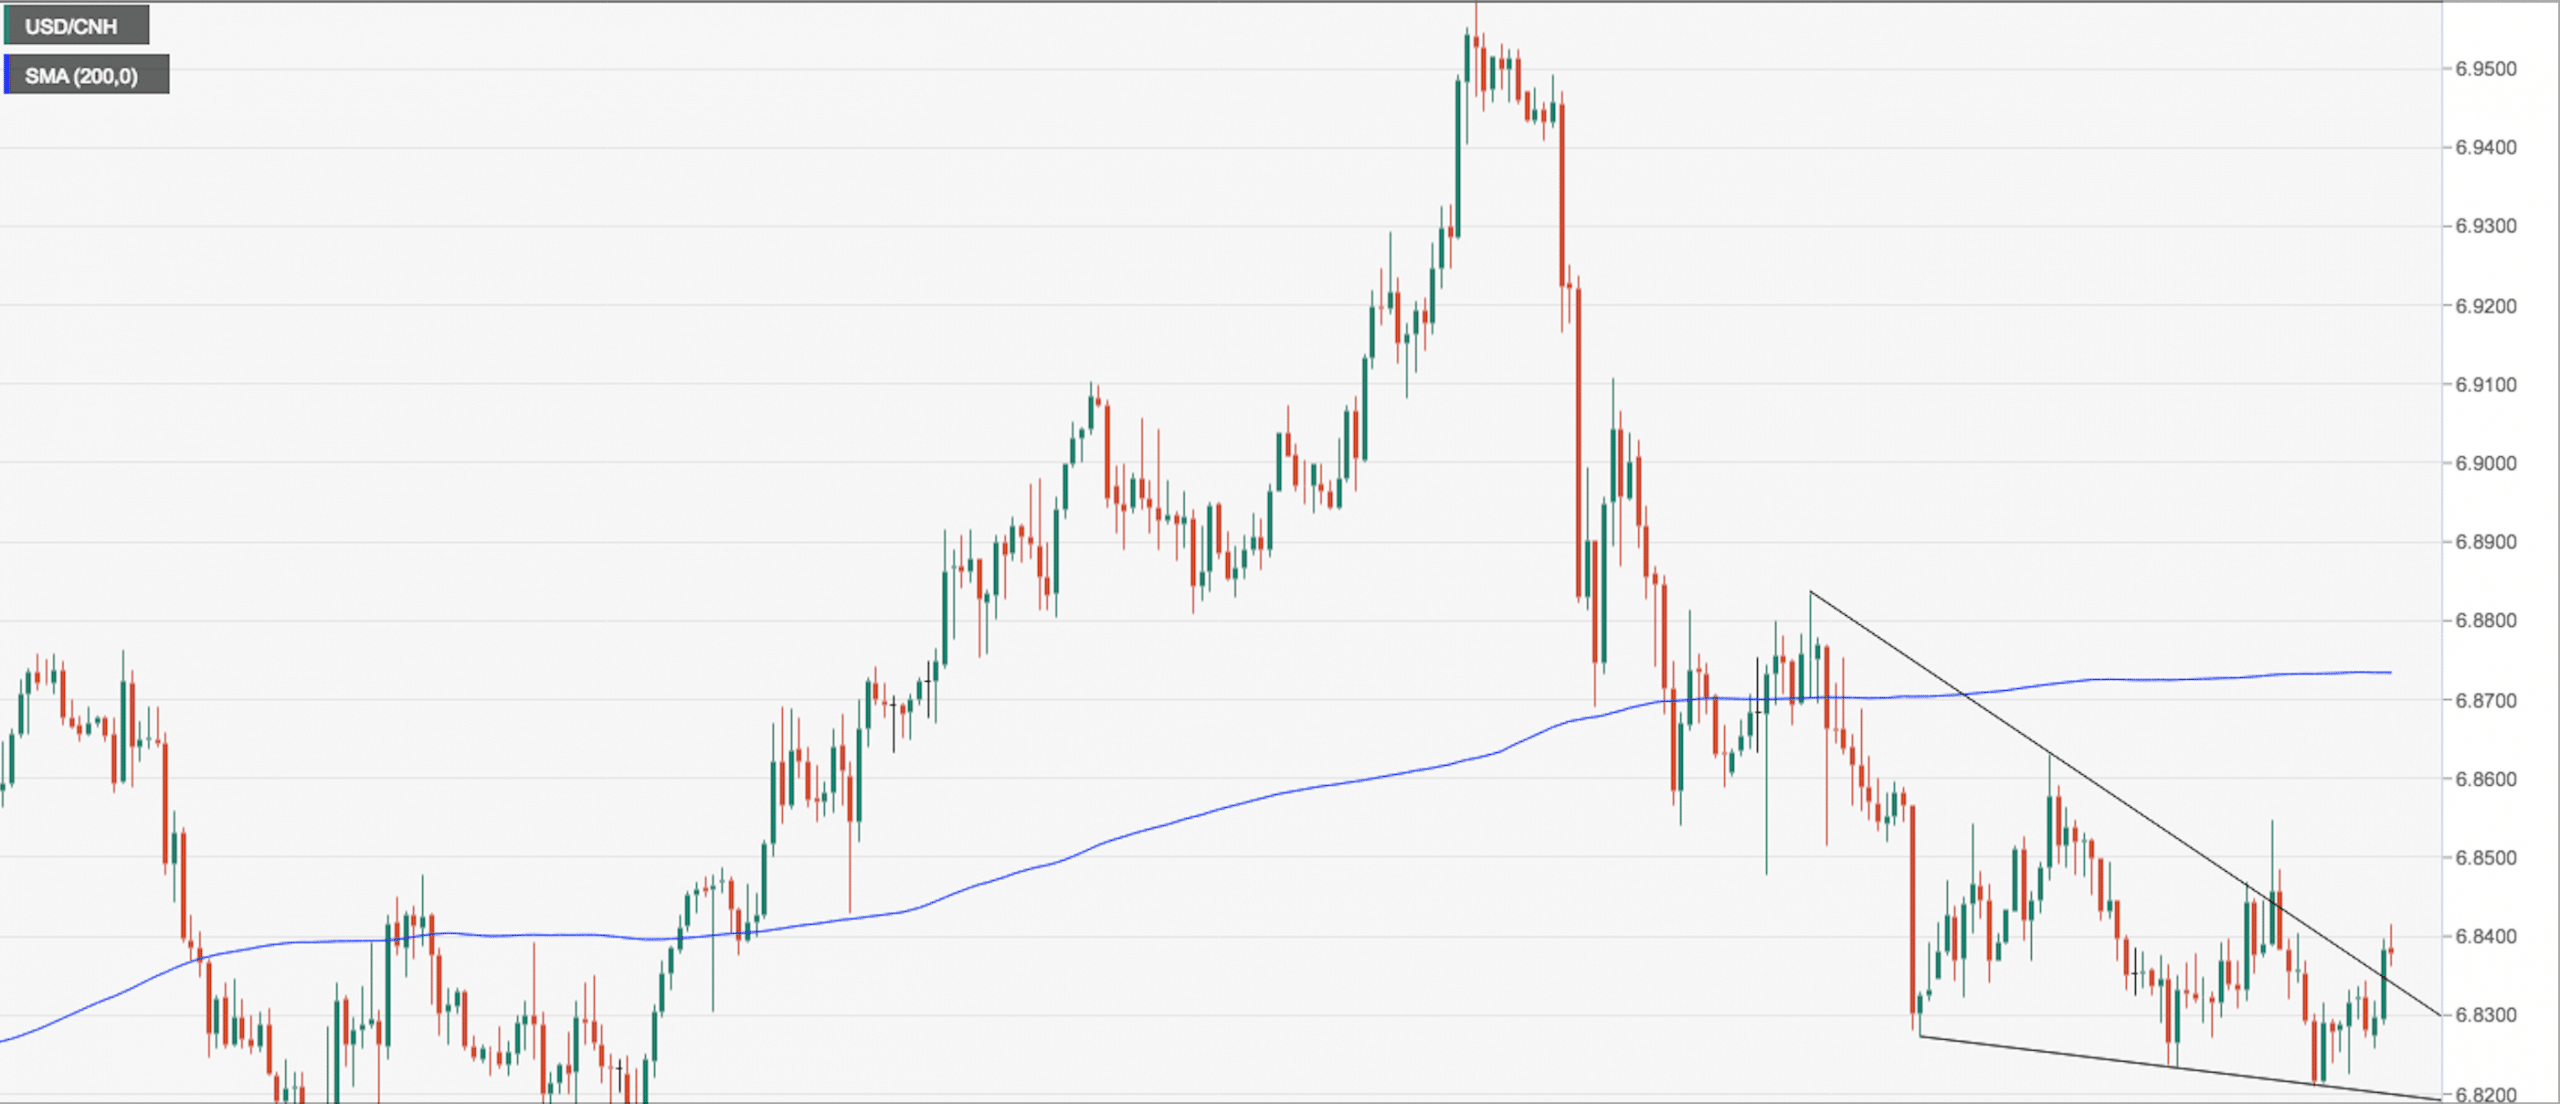
- The USD/CNH hourly chart shows a bullish relative strength divergence (RSI) and an upside break of the ascending triangle.
- Hence, the spot looks set to re-test the 200-hour moving average (MA) of 6.87.
- On the downside, 6.81 is the level to beat for the bears.
Hourly chart
Spot Rate: 6.8342
Daily High: 6.8412
Daily Low: 6.8264
Trend: Bullish
R1: 6.8383 (5-day MA)
R2: 6.8620 (10-day MA)
R3: 6.87 (200-hour MA)
Support
S1: 6.81 (support as per the hourly chart)
S2: 6.7745 (July 31 low)
S3: 6.7195 (50-day MA)
