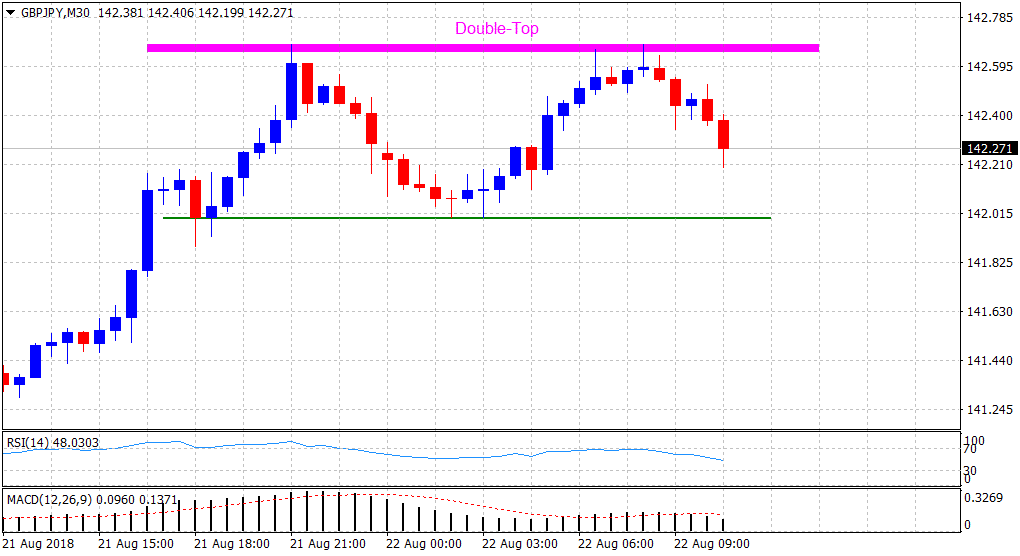
“¢ The cross struggled to build on the overnight upsurge and now seems to have formed a bearish double-top chart pattern near the 142.65-70 region on the 30-min. chart.
“¢ Technical indicators on the mentioned chart have started drifting into bearish territory and further add credence to the bearish formation.
“¢ The pattern, however, will be confirmed only once the cross decisively breaks below the neckline support near the 142.00 round figure mark.
GBP/JPY 30-min. chart
Spot Rate: 142.27
Daily High: 142.68
Trend: Bearish below the 142.00 handle
Resistance
R1: 142.68 (current day swing high)
R2: 143.10 (R1 daily pivot-point)
R3: 143.53 (20-day SMA)
Support
S1: 142.00 (neck-line support of the bearish formation)
S2: 141.35 (horizontal support)
S3: 141.08 (S1 daily pivot-point)
