“¢ The pair remained under some selling pressure for the fourth consecutive session and dropped to near 2-1/2 month lows during the European trading session.
“¢ Today’s downfall followed an overnight breakdown below an important neckline of a bearish head & shoulders chart pattern on the short-term chart.
“¢ Hence, an extension of the near-term downward trajectory, possibly towards retesting the very important 200-day SMA, now looks a distinct possibility.
“¢ However, oversold conditions on the 4-hourly chart, as depicted by RSI (14) warrant some short-term consolidation before the next leg of downside.
USD/CHF 4-hourly chart
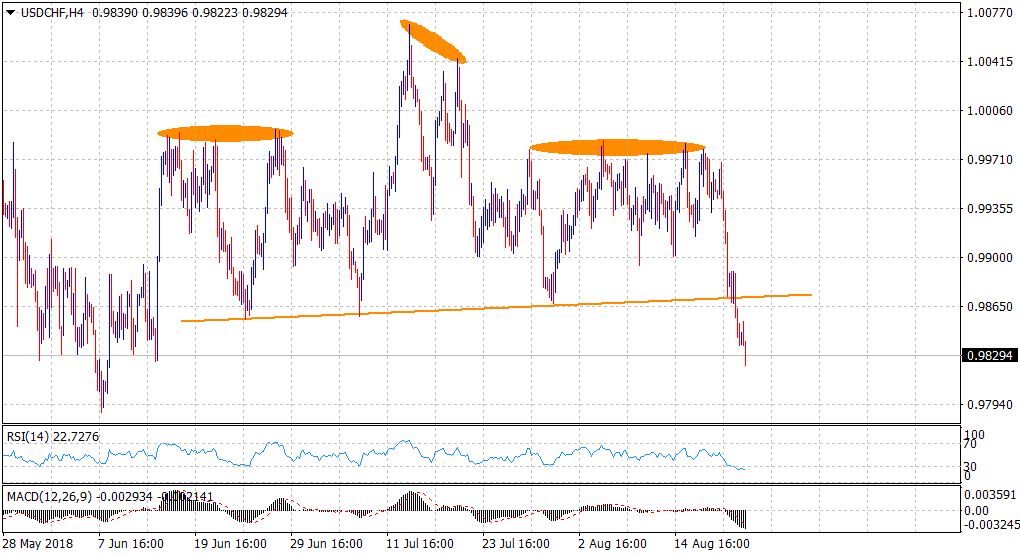
Spot Rate: 0.9829
Daily High: 0.9854
Trend: Bearish
Resistance
R1: 0.9854 (current day swing high)
R2: 0.9875 (neckline support break-point)
R3: 0.9900 (round figure mark)
Support
S1: 0.9800 (round figure mark)
S2: 0.9788 (June 7 swing low)
S3: 0.9755 (200-day SMA)
