“¢ The cross managed to find decent buying interest near the 142.00 handle and built on the overnight strong upsurge, hitting near two-week tops in the last hour.
“¢ With technical indicators on hourly charts holding comfortably in bullish territory, a follow-through up-move beyond 142.70 horizontal zone would mark a near-term bullish breakout.
“¢ However, indicators on the daily chart are yet to catch up with the positive momentum and might turn out to be the only factor that might keep a lid on any meaningful up-move.
GBP/JPY 1-hourly chart
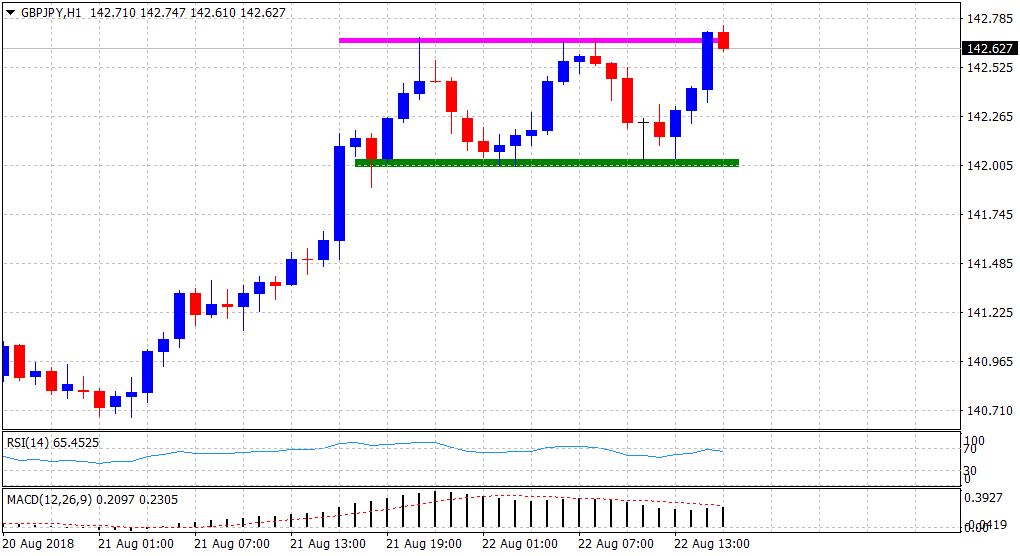
Spot Rate: 142.63
Daily Low: 142.00
Trend: Bullish above 142.70
Resistance
R1: 143.10 (R1 daily pivot-point)
R2: 143.53 (20-day SMA)
R3: 143.80 (horizontal zone)
Support
S1: 142.00 (current day swing low)
S2: 141.68 (50-period SMA H1)
S3: 141.08 (S1 daily pivot-point)
