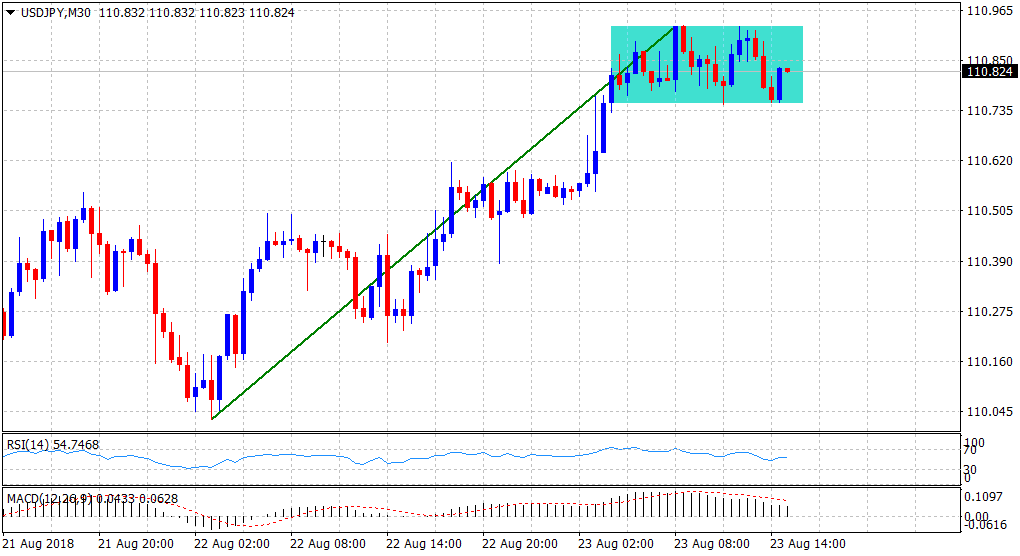
“¢ The pair now seems to have entered a consolidation phase and was seen oscillating in a narrow trading range, forming a rectangular chart pattern on the 30-min. chart.
“¢ A rectangle is usually seen as a continuation pattern, representing a brief pause in the broader trend, though sometimes also mark a significant top.
“¢ A decisive break through the 111.00 handle would mark the completion of the rectangle pattern and pave the way for any further near-term appreciating move.
USD/JPY 30-min chart
Spot Rate: 110.82
Daily Low: 110.52
Daily High: 110.93
Trend: Bullish above 111.00 handle
Resistance
R1: 111.01 (R2 daily pivot-point)
R2: 111.43 (last week’s swing high)
R3: 112.00 (round figure mark)
Support
S1: 110.52 (current day swing low)
S2: 110.0.3 (100-day SMA)
S3: 109.80 (S2 daily pivot-point)
