“¢ The precious metal’s attempted rebound in the last hour faced rejection at 200-hour EMA, with bears eyeing a possible retest of daily lows.
“¢ Technical indicators on the 1-hourly chart continue to hold in bearish territory and thus, increase prospects for an extension of the current pullback.
“¢ Firming Fed rate hike expectations and resurgent USD demand turned out to be key factors exerting some fresh downward pressure on the commodity.
“¢ However, a sustained move beyond 200-hour EMA barrier should assist bulls to make a fresh attempt towards conquering the key $1200 psychological mark.
Gold 1-hourly chart
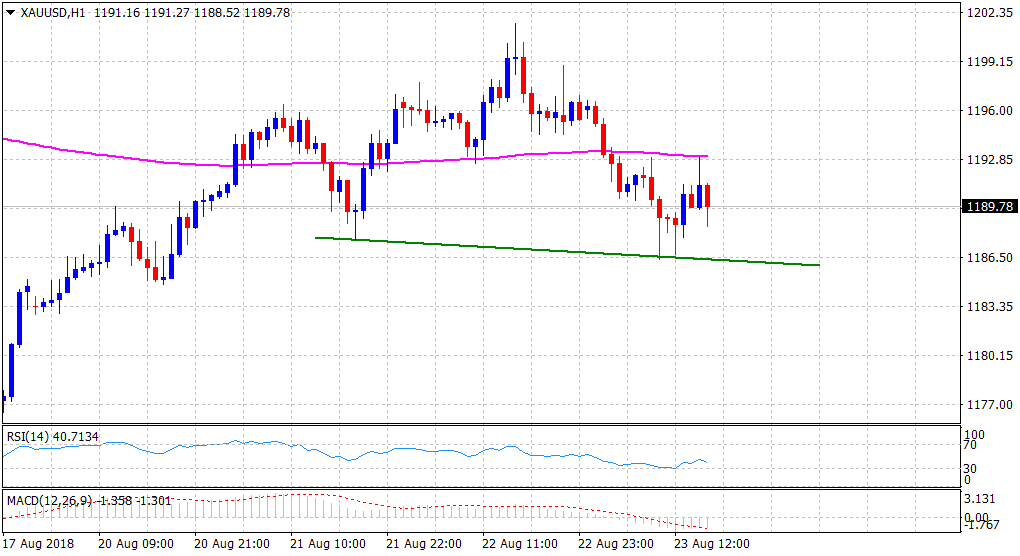
Spot Rate: $1189.78
Daily High: $1196.63
Daily Low: $1186.37
Trend: Turning bearish again
Resistance
R1: $1195.65 (horizontal zone)
R2: $1201.60 (overnight swing high)
R3: $1204.50 (previous YTD low set on Aug. 3)
Support
S1: $1186.40 (current day swing low)
S2: $1182.80 (weekly low set on Monday)
S3: $1174.05 (recent daily closing low)
