- USD/JPY bulls are back and eager to resume the main bear trend.
- USD/JPY is forming a bull channel and the market broke above it. The 50, 100 and 200-period simple moving average are rising and widening up all suggesting a bullish bias. Targets to the upside are located at 111.45 and 111.54-111.64 area.
- A bear breakout below 110.75 would invalidate the bullish bias.
USD/JPY 15-minute chart
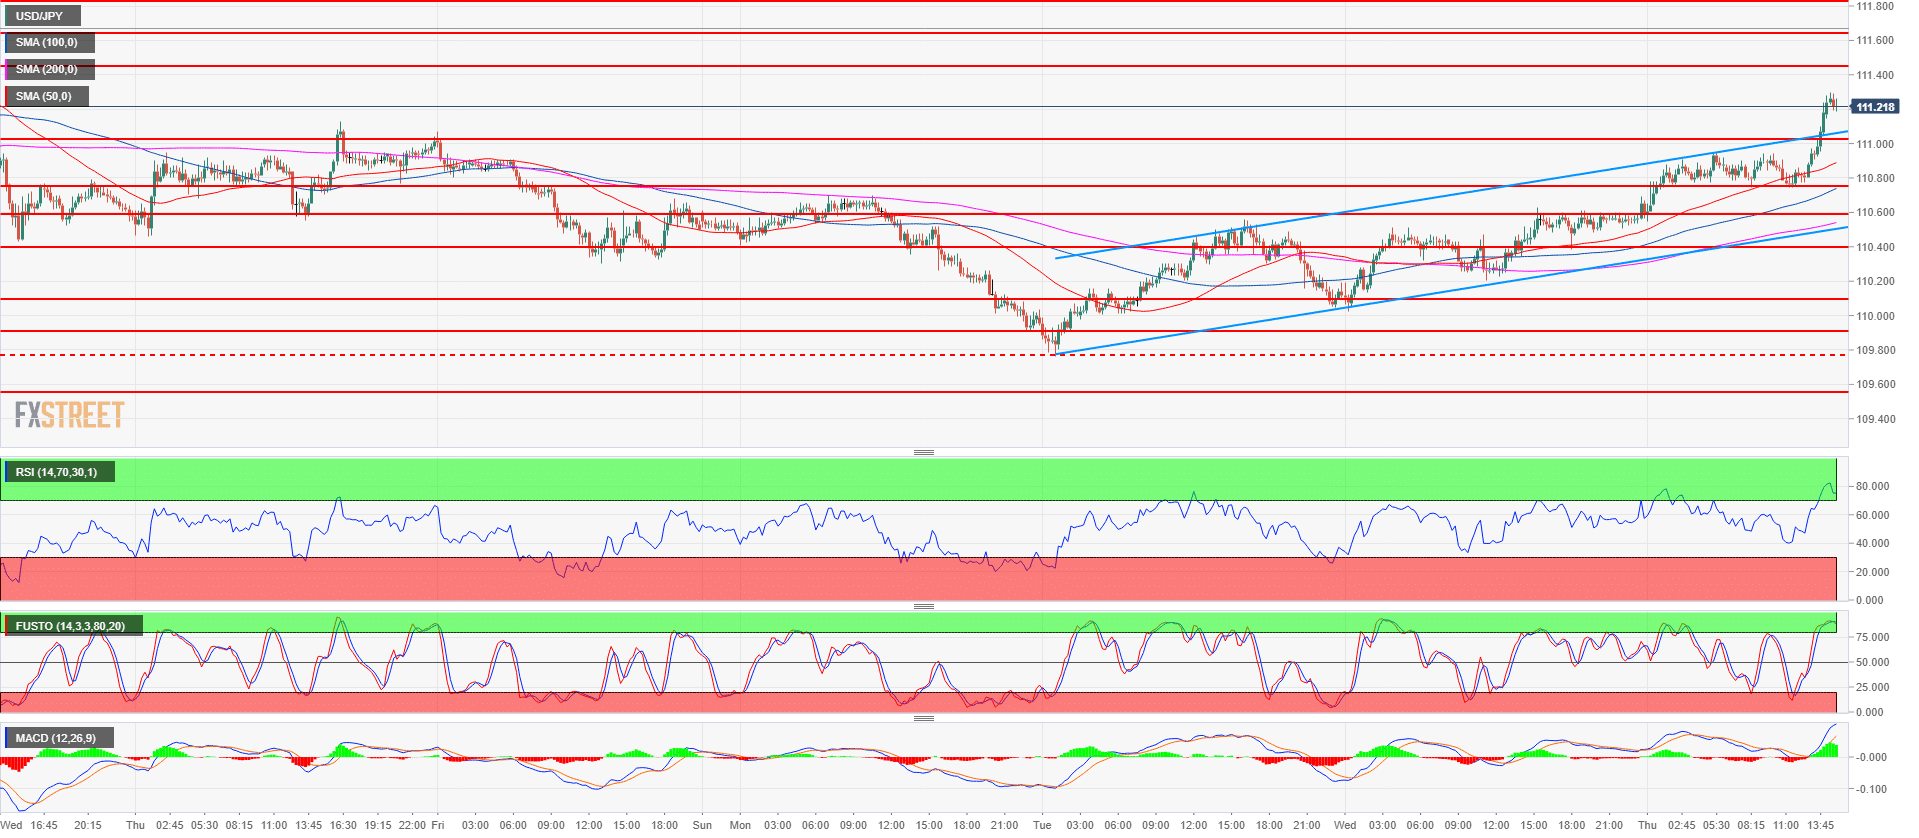
Spot rate: 111.20
Relative change: 0.59%
High: 111.30
Low: 110.50
Main trend: Bullish
Resistance 1: 111.45 August 8 high
Resistance 2: 111.54-111.64 area, August 6, high and supply/demand level
Resistance 3: 111.82-112.00 area, supply level and figure
Support 1: 111.00 figure
Support 2: 110.75, July 23 low
Support 3: 110.58 July 26 swing low
Support 4: 110.40 supply/demand level
Support 5: 110.10 August 13 swing low
Support 6: 109.91-97 area, 200 and 100-day simple moving average
Support 7: 109.37 June 25 swing low
Support 8: 109.19 June 8 low
