- GBP/USD bears are working hard to maintain the main bear trend and preventing the market to reach 1.2957 key level.
- GBP/USD is essentially trading at the top of the bear channel capped by the 200-period simple moving average and 1.2868 resistance. Targets to the downside remain 1.2800 and 1.2700-1.2723 zone.
- A sustained bull breakout above 1.2868 would invalidate the bearish bias.
GBP/USD 15-minute chart
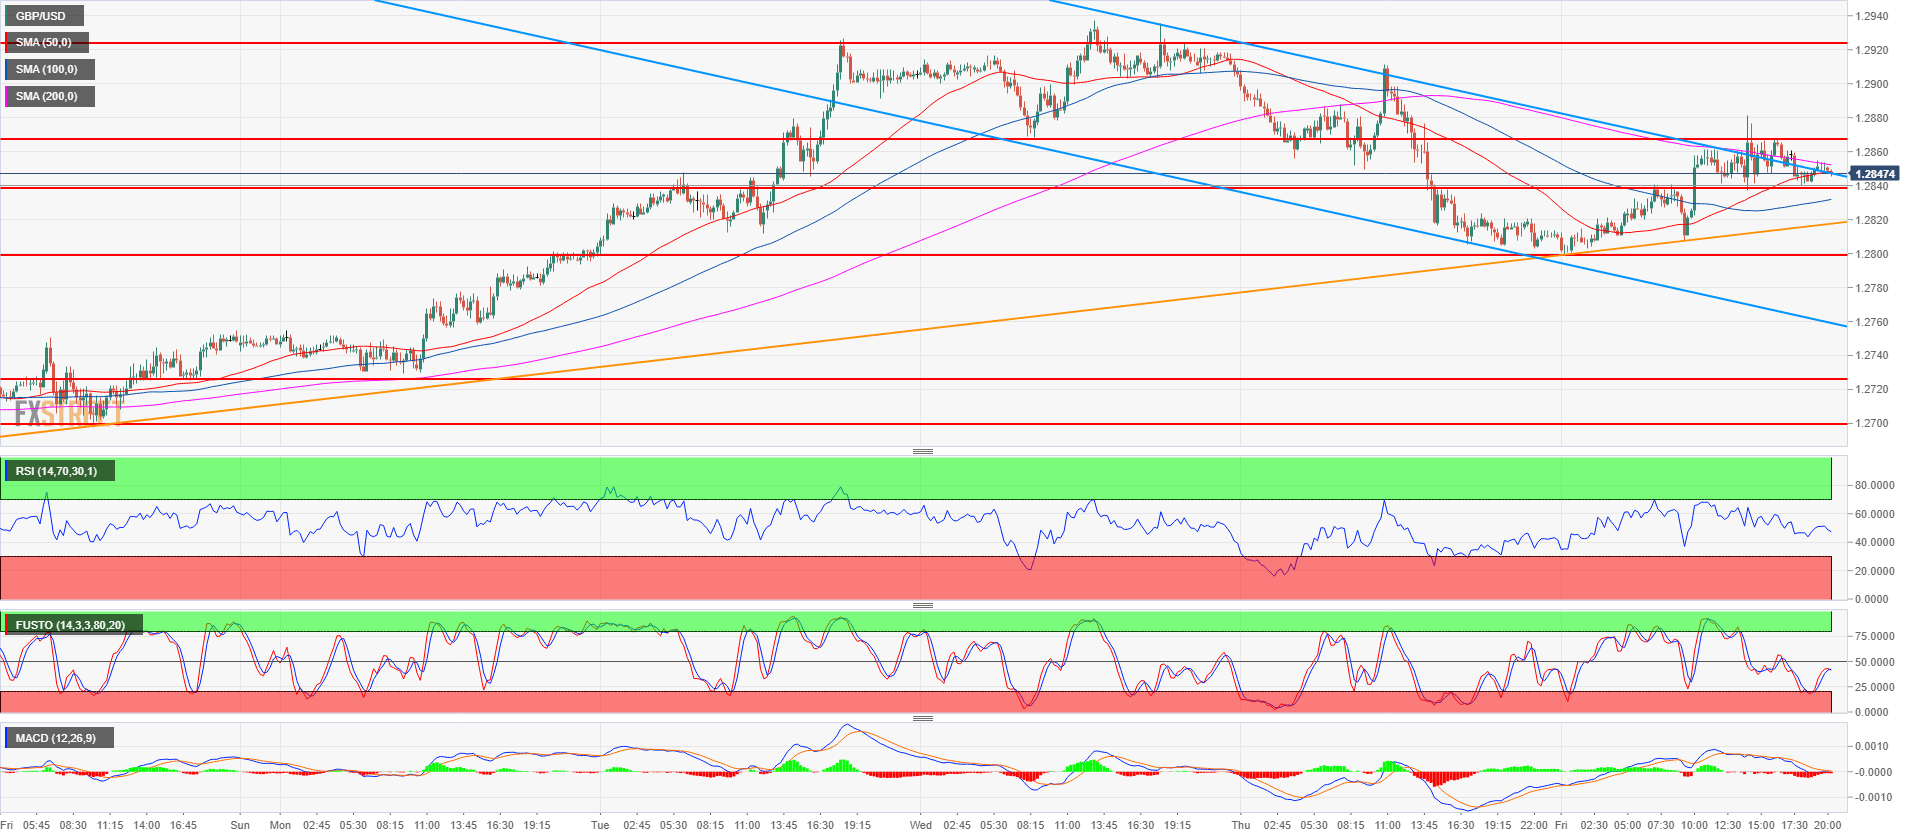
Spot rate: 1.2846
Relative change: 0.28%
High: 1.2881
Low: 1.2799
Trend: Bearish below 1.2870
Resistance 1: 1.2868 August 22 low
Resistance 2: 1.2900-1.2923 area, figure and August 7 low
Resistance 3: 1.2900-1.2923 area, figure and August 7 low
Resistance 4: 1.2957 July 19 swing low
Resistance 5: 1.3082-1.3100 supply/demand level and figure
Resistance 6: 1.3214 July 26 swing high
Support 1: 1.2838, August 10 high
Support 2: 1.2800 figure
Support 3: 1.2700-1.2723 zone, figure and August 10 low
Support 4: 1.2700 figure
Support 5: 1.2661 current 2018 low
