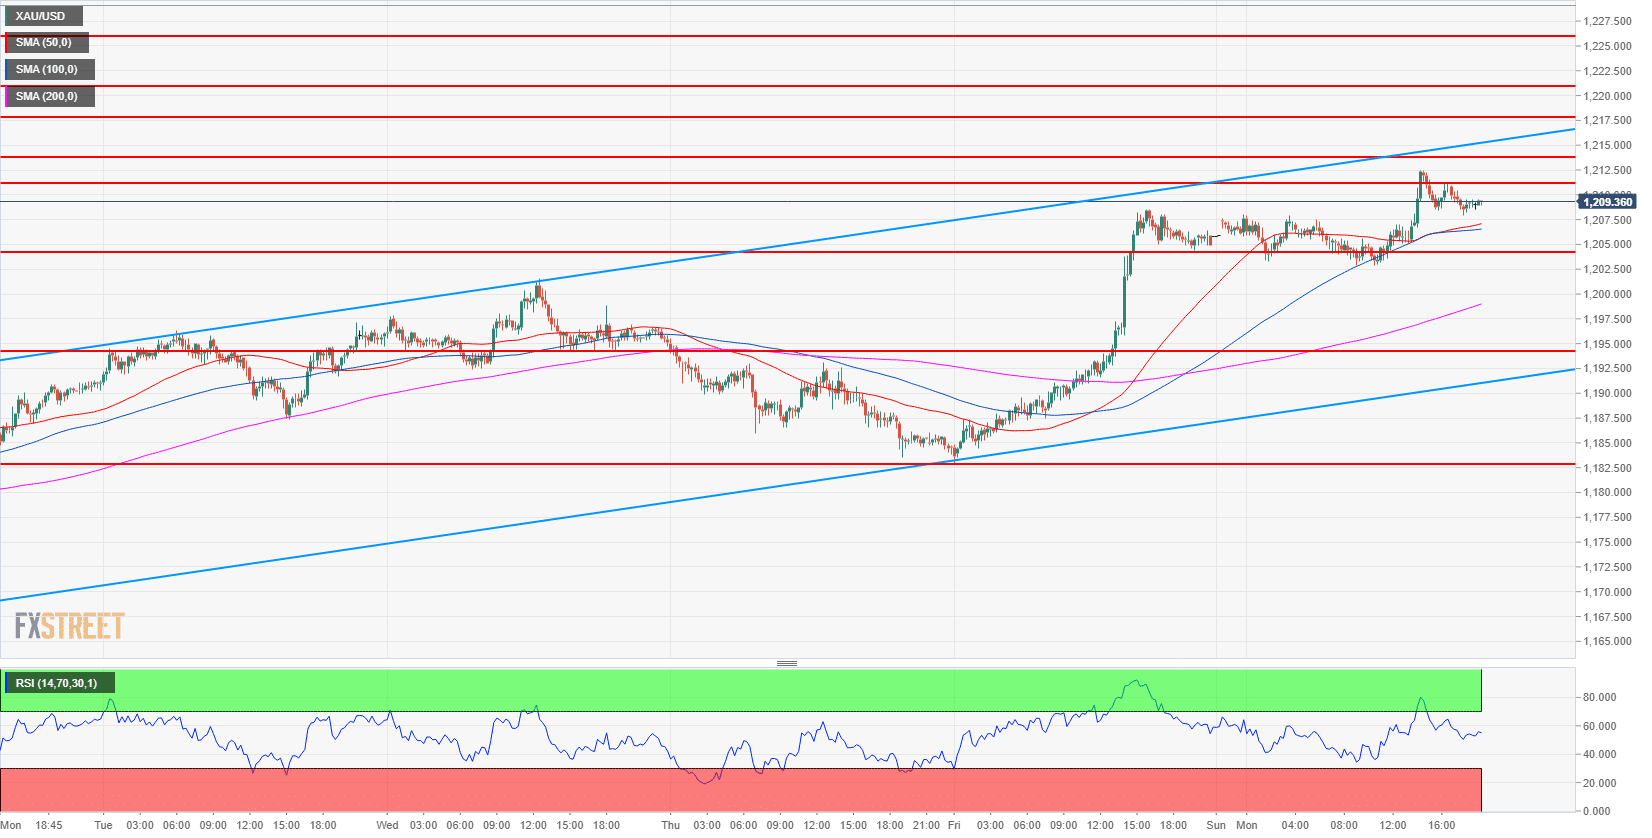
- Gold bulls broke above the June 14 bear trendline shifting the short-momentum to bullish.
- On the 15-minute chart, gold bulls are evolving in a bull channel with a rising 200-period simple moving average. Bulls are trading above 1,205.50, August 3 swing low (key level). Targets to the upside are located at 1,213.70 (July 31 low) and 1,217.89-1,220.90 zone.
- A sustained bear breakout below 1,182.90 August 24 low would invalidate the bullish bias.
Spot rate: 1,209.48
Relative change: 0.31%
High: 1,212.50
Low: 1,202.90
Trend: Bearish
Short-term trend: Bullish
Resistance 1: 1,211.17 July 19 low
Resistance 2: 1,213.70 July 31 low
Resistance 3: 1,217.89-1,220.90 zone, August 6 high and July 18 low
Resistance 4: 1,225.90 July 17 low
Support 1: 1,204.10, August 3 swing low (key level)
Support 2: 1,194.30 March 10, 2017 low
Support 3: 1,182.90 August 24 low
Support 4: 1,172.82 current 2018 low
