- USD/JPY bulls are trying to resume the main bull trend as the market finds support at the 50-day simple moving average.
- On the 15-minute chart, USD/JPY bulls are currently hesitant to resume to move up of the last four days as the market is trading below the bull channel and the bear trendline (blue dotted line). USD/JPY is also trading below flat 100 and 200-period simple moving averages.
- All-in-all the pair might continue the correction down towards 110.75 before resuming the uptrend.
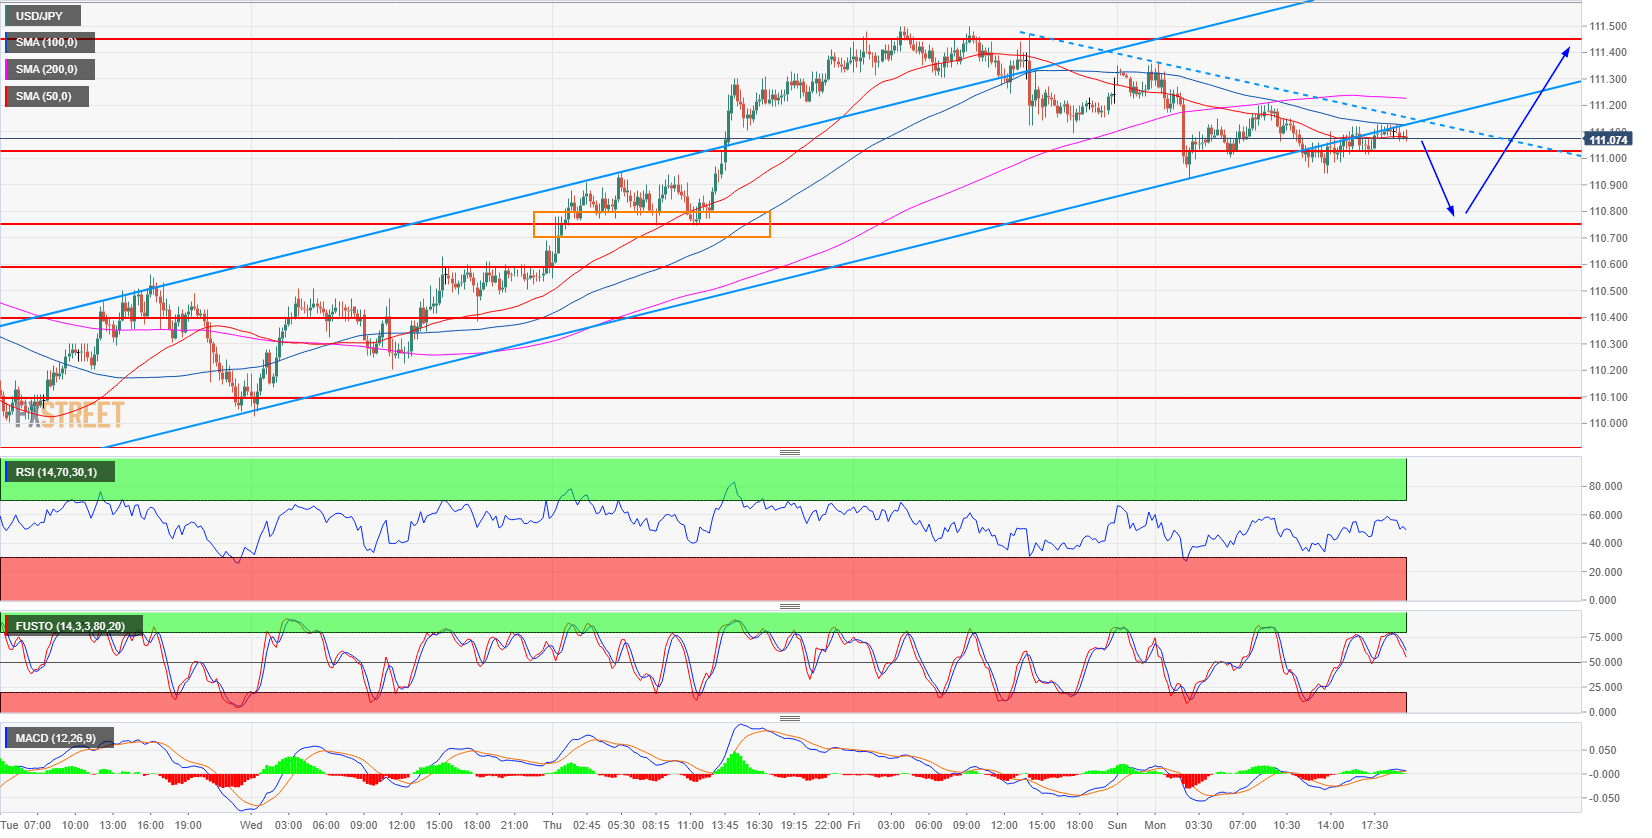
Spot rate: 111.07
Relative change: -0.15%
High: 111.36
Low: 110.92
Main trend: Bullish
Resistance 1: 111.45 August 8 high
Resistance 2: 111.54-111.64 area, August 6, high and supply/demand level
Resistance 3: 111.82-112.00 area, supply level and figure
Support 1: 111.00 figure
Support 2: 110.75, July 23 low
Support 3: 110.58 July 26 swing low
Support 4: 110.40 supply/demand level
Support 5: 110.10 August 13 swing low
Support 6: 109.91-97 area, 200 and 100-day simple moving average
Support 7: 109.37 June 25 swing low
Support 8: 109.19 June 8 low
