“¢ The near-term momentum continues to favour bearish traders, with the pair falling below June swing low level of 0.9788 to over four-month lows on Tuesday.
“¢ The pair remains poised to test the very important 200-day SMA, which if broken will be a key for sellers and pave the way for a continuation of the bearish trajectory.
“¢ With technical indicators gradually moving towards near-term oversold conditions, any further downside is likely to be limited by 38.2% Fibonacci retracement level of the 0.9188-1.0068 upsurge.
USD/CHF daily chart
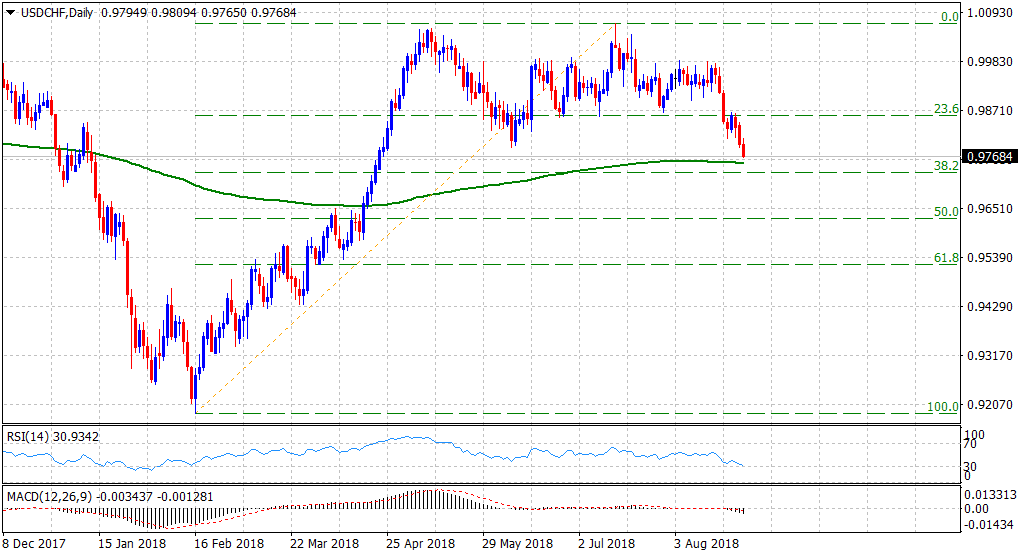
Spot Rate: 0.9768
Daily High: 0.9809
Trend: Bearish
Resistance
R1: 0.9788 (June monthly low support break-point)
R2: 0.9809 (current day swing high)
R3: 0.9836 (R1 daily pivot-point)
Support
S1: 0.9752 (200-day SMA)
S2: 0.9730 (38.2% Fibo. level)
S3: 0.9700 (round figure mark)
