“¢ The precious metal has been oscillating between two converging trend-line over the past 24-hours or so, forming a bearish reversing – rising wedge chart pattern on the 15-min. chart.
“¢ A convincing break below the pattern support, near $1210 area, will confirm the bearish formation and indicate that the near-term recovery move might have started losing steam.
“¢ However, technical indicators on hourly and daily charts hold in positive territory and support prospects for an extension of the recent positive momentum.
“¢ Hence, it would be prudent to wait for a convincing break in either direction before traders start positioning for the commodity’s near-term trajectory.
Gold 15-min. chart
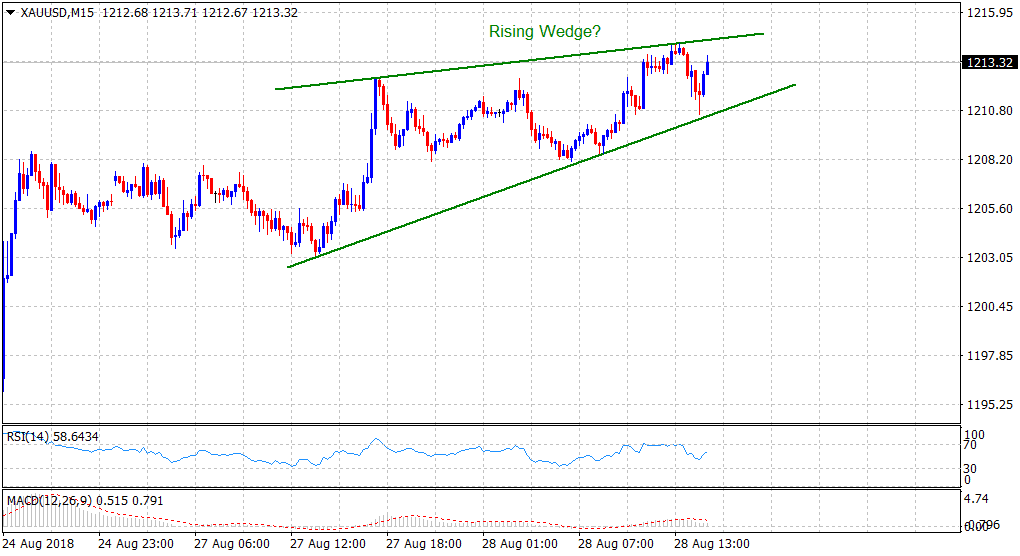
Spot Rate: $1213.32
Daily High: $1214.32
Daily Low: $1208.08
Trend: Sideways/consolidative
Resistance
R1: $1214.78 (R1 daily pivot-point)
R2: $1220 (horizontal zone)
R3: $1226.40 (50-day SMA)
Support
S1: $1210.60 (pattern support)
S2: $1205.18 (S1 daily pivot-point)
S3: $1200 (psychological round figure mark)
