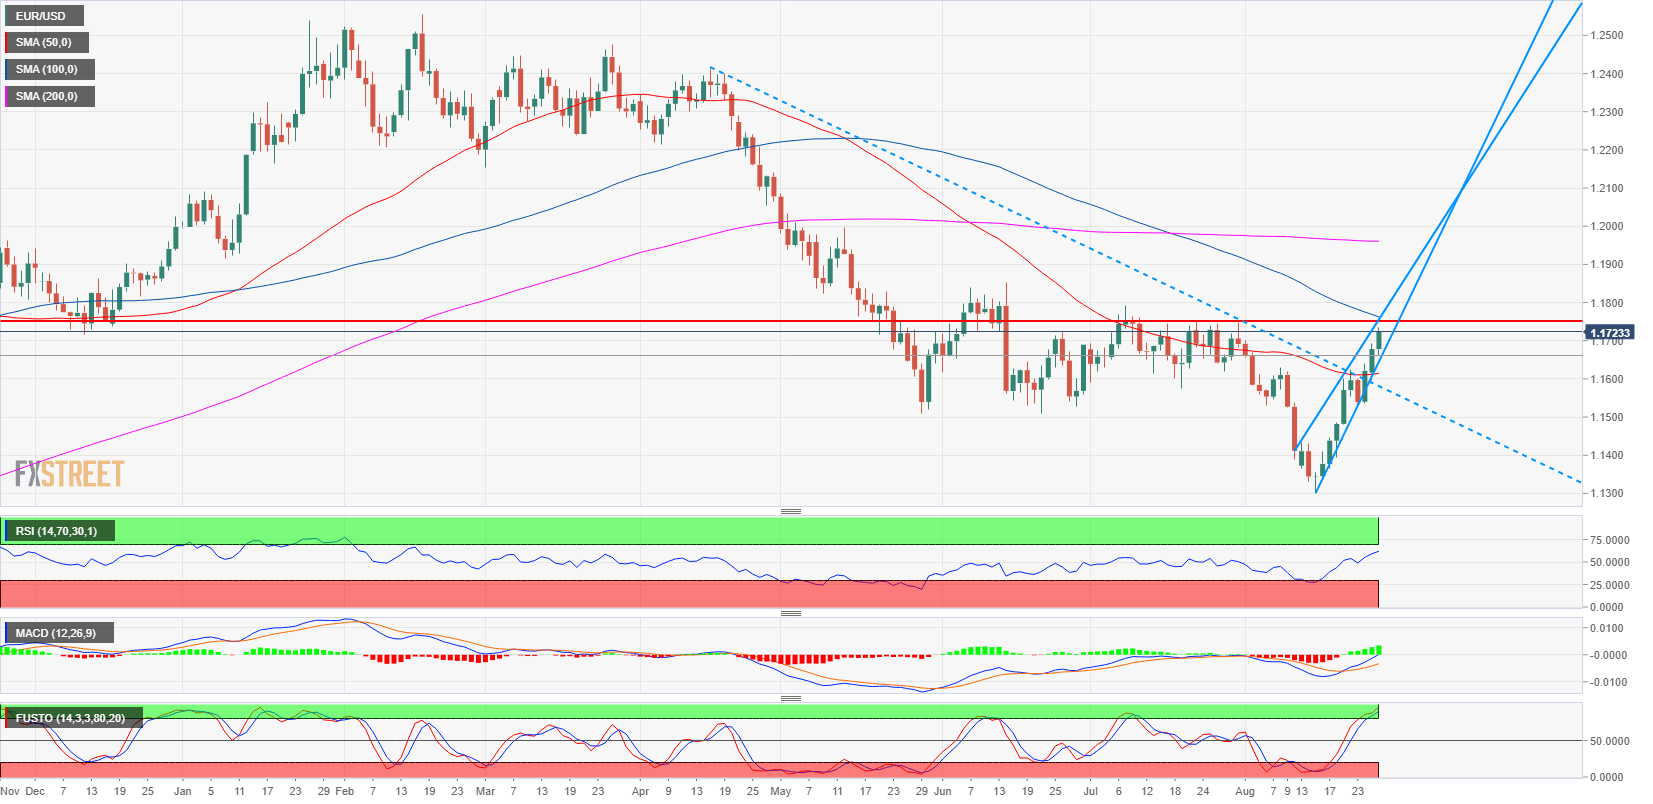
- EUR/USD bulls are challenging the main bear trend as they broke above a multi-month bear trendline (blue dots) and 1.1628 swing high.
- EUR/USD is very close to a key resistance level at 1.1750 which was active this summer in July. The daily RSI and the MACD are in positive territories while the Stochastics Oscillator is above 80, suggesting strong bullish momentum.
- Technically bulls have what it takes to break above 1.1750 but it remains to be seen if the market can break above it on the first go or if we enter a consolidation phase first. The market spent so much time below 1.1750 in the last months so the resistance might be tough to break. When broken, it would open the possibility that the bear trend is over.
Spot rate: 1.1723
Relative change: 0.39%
High: 1.1734
Low: 1.1662
Main trend: Bearish
Short-term trend: Bullish above 1.1542
Resistance 1: 1.1750 supply level
Resistance 2: 1.1800 figure
Resistance 3: 1.1850 June 14 swing high
Support 1: 1.1700 figure
Support 2: 1.1667 August 2 high
Support 3: 1.1654 August 27 high, Asia high
Support 4: 1.1628 August 8 high key level
Support 5: 1.1600 figure
Support 6: 1.1572 July 19 low
Support 7: 1.1542 supply/demand level
