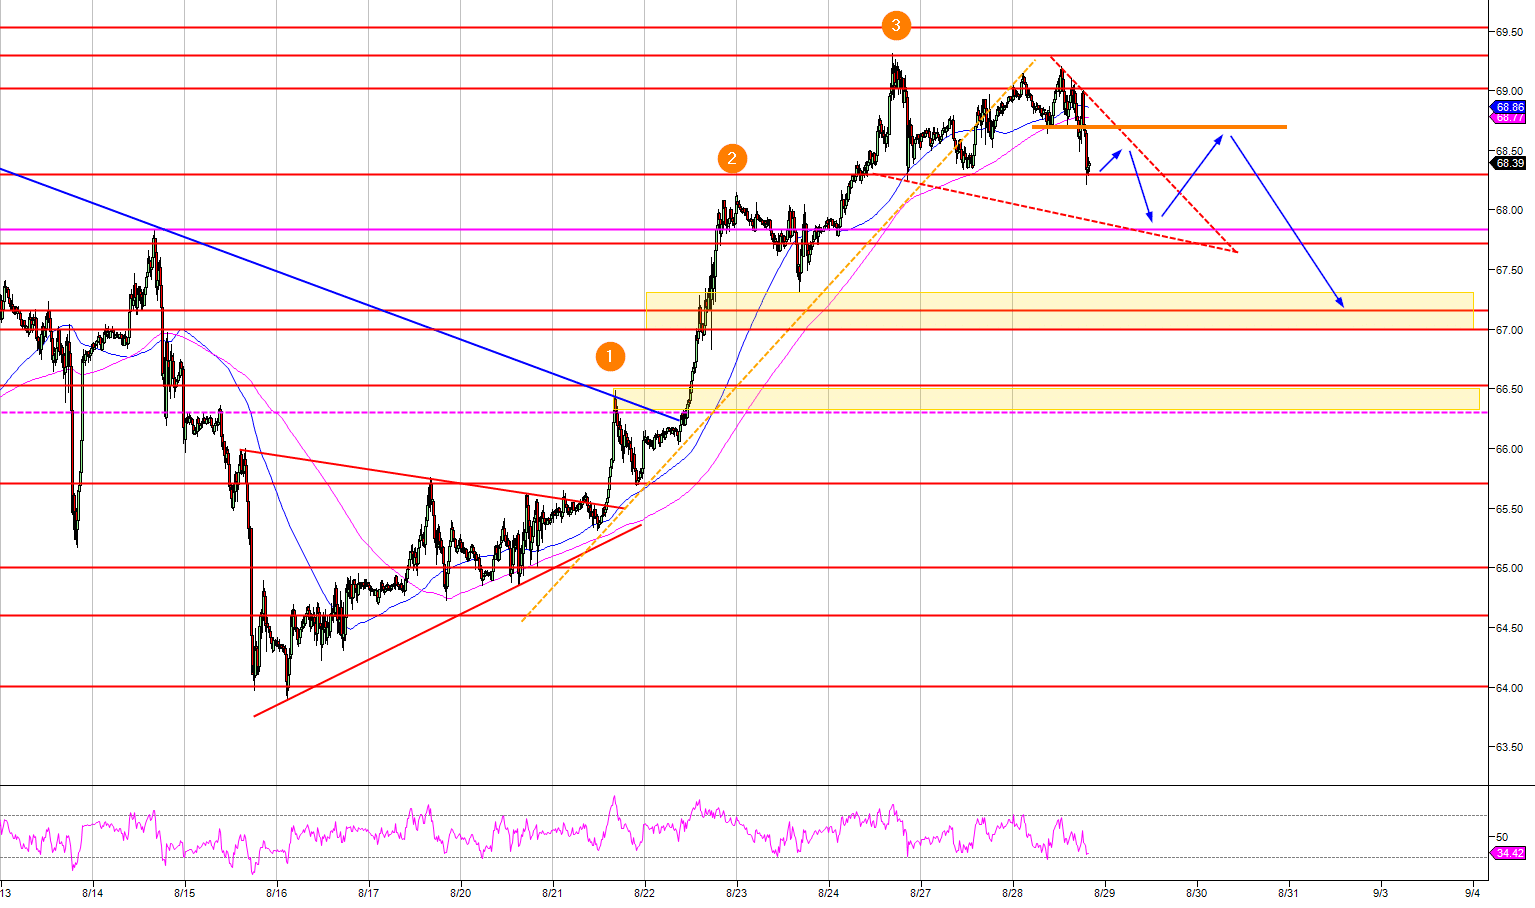
- The crude oil bull leg is having a break as the market made three pushes up after the triangle compression pattern (red) and failed to break above the 69.00 figure. The market broke below the yellow bull trendline and is now testing the 68.30 support.
- Oil might found some short-lived support but now the short-term momentum is to the downside with the market trading below the 100 and 200-period simple moving averages. Bears target are located in the 67.00-67.30 zone and 66.30-66.53 area.
- A sustained breakout above 69.00-69.30 zone would invalidate the short-term bearish bias.
Crude oil WTI 15-minute chart (bearish scenario)
Spot rate: 68.33
Relative change: 0.90%
High: 69.17
Low: 68.19
Main Trend: Bullish
Short-term trend: Bearish below 68.30 or on a failure above 69.00
Resistance 1: 69.00 figure
Resistance 2: 69.30 August 24 high
Resistance 3: 69.44 June 25 high
Resistance 4: 70.00 figure
Support 1: 68.30 supply/demand level
Support 2: 67.84 August 14 swing high
Support 3: 67.16 June 14 high
Support 4: 67.72 June 26 low
Support 5: 67.00-67.30 zone, figure and August 23 swing low
Support 6: 66.30-66.53 zone, July 18 swing low and June 20 high
Support 7: 65.71, June 22 low
Support 8: 64.60 May 28 low
Support 9: 64.00 figure
Support 10: 63.63 June 11 low
Support 11: 62.40 June 18 low
