“¢ The pair snapped four consecutive days of the winning streak and retreated sharply on Thursday, forming a bearish double top chart pattern near the 0.6720-25 region on the 1-hourly chart.
“¢ A subsequent break below 200-hour SMA and a short-term ascending trend-line support, held since mid-August, added credence to the short-term bearish formation.
“¢ Technical indicators on hourly and daily charts are still far from oversold conditions and thus, increase prospects for additional downside in the near-term.
NZD/USD 1-hourly chart
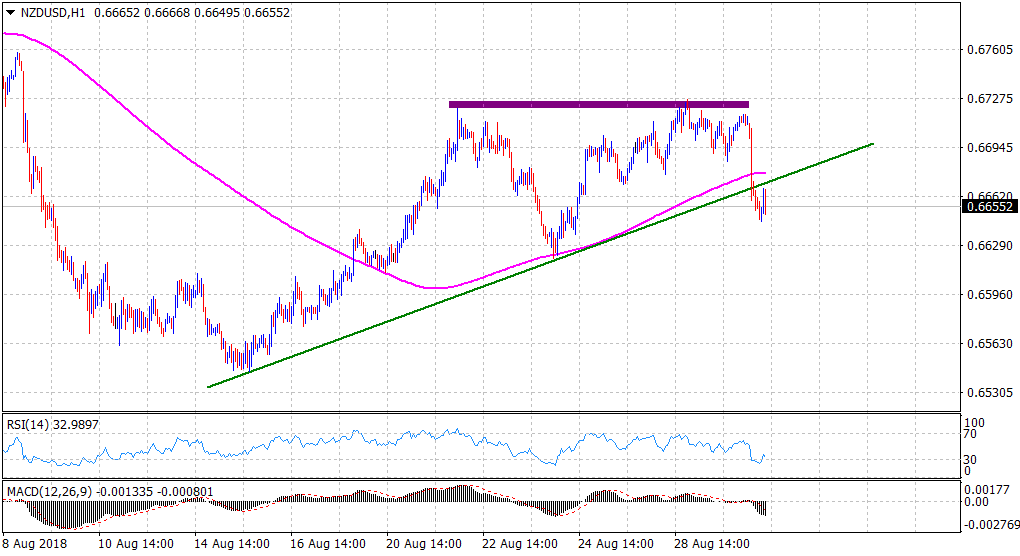
Spot Rate: 0.6655
Daily High: 0.6717
Trend: Bearish
Resistance
R1: 0.6678 (200-period SMA H1)
R2: 0.6700 (round figure mark)
R3: 0.6728 (R1 daily pivot-point)
Support
S1: 0.6626 (S1 weekly pivot-point)
S2: 0.6600 (round figure mark)
S3: 0.6565 (recent daily closing low set on Aug. 15)
