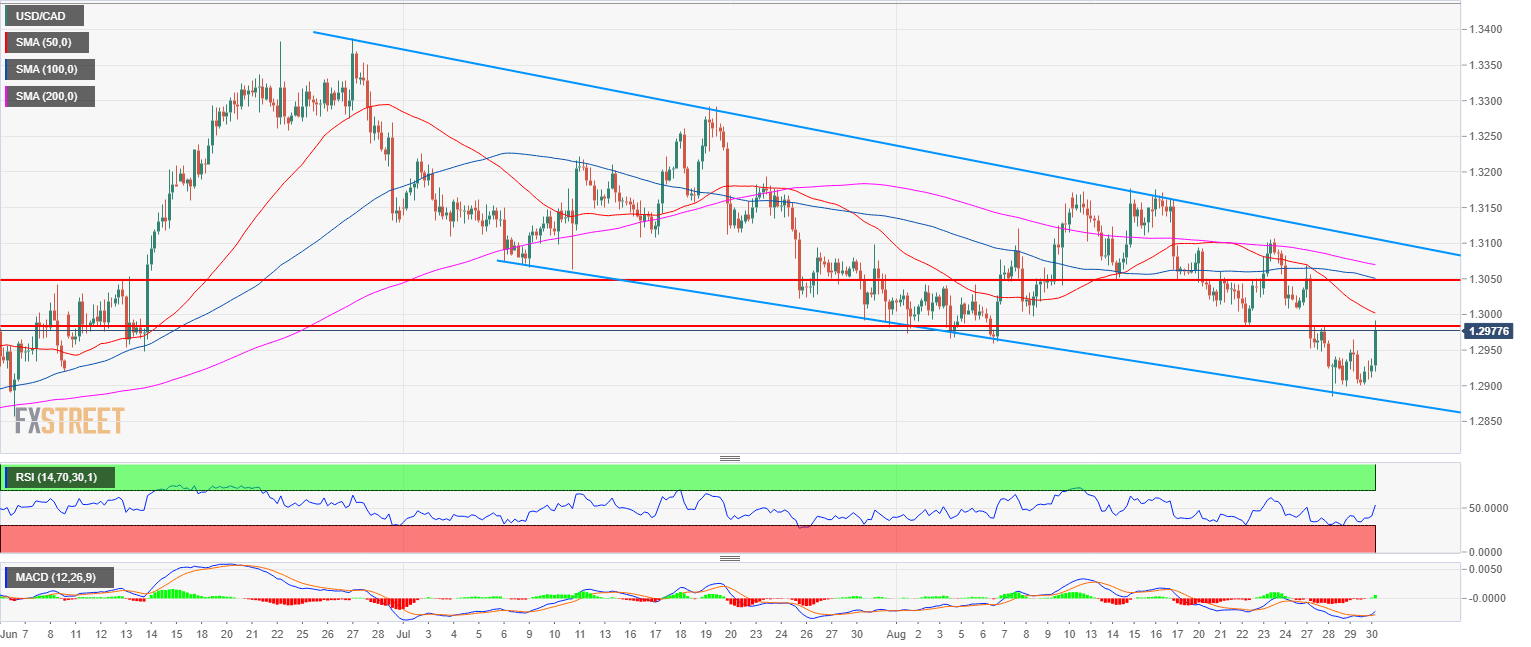
- USD/CAD is evolving in a bear channel within the main bull trend.
- USD/CAD is rebounding from the 1.2900 level and the lower end of the channel. The market is currently testing 1.2984 (August 29 swing low). A break above the level would open the door to 1.3048-1.3066 area (August 14 low and July 9 low).
USD/CAD 4-hour chart
Spot rate: 1.2856
Relative change: -0.06%
High: 1.2964
Low: 1.2899
Trend: Bullish
Short-term trend: Bullish above 1.2900
Resistance 1: 1.2984 August 29 swing low
Resistance 2: 1.3000 figure
Resistance 3: 1.3022 July 25 low
Resistance 4: 1.3048-1.3066 area, August 14 low and July 9 low
Resistance 5: 1.3100 figure
Resistance 6: 1.3120-1.3155 zone, supply/demand level and June 18 low
Resistance 7: 1.3172 August 13 swing high
Support 1: 1.2959 August 7 swing low
Support 2: 1.2920 supply level
Support 3: 1.2900 figure
Support 5: 1.2857 June 6 low
Support 6: 1.2800 figure
