“¢ The pair’s corrective slide from 3-1/2 week tops, set on Wednesday, now seems to have paused near 23.6% Fibonacci retracement level of the 109.98-111.83 up move.
“¢ The mentioned support also nears 100-hour SMA, which if broken would suggest that the recent up-move from sub-110.00 level might have already run out of steam.
“¢ With technical indicators on the 1-hourly chart gaining negative momentum, a follow-through weakness should pave the way for an extension of the retracement slide.
USD/JPY 1-hourly chart
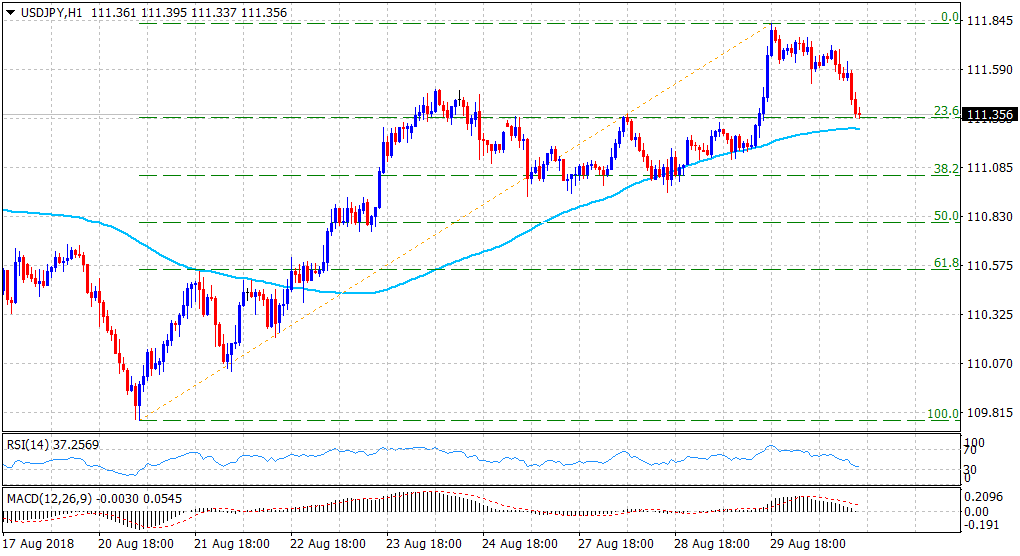
Spot Rate: 111.36
Daily High: 111.76
Trend: Turning bearish
Resistance
R1: 111.68 (overnight daily closing level)
R2: 111.97 (R1 daily pivot-point)
R3: 112.15 (monthly high set on Aug. 1)
Support
S1: 110.94 (weekly low set on Monday)
S2: 110.52 (S3 daily pivot-point)
S3: 110.24 (100-day SMA)
