- The US Dollar Index (DXY) is having a deep pullback in the main bull trend.
- DXY broke below a bull trendline and the 50-day simple moving average suggesting that bears want to take control.
- However, the Index is still making higher highs and higher lows keeping the bull trend for the moment intact.
DXY daily chart
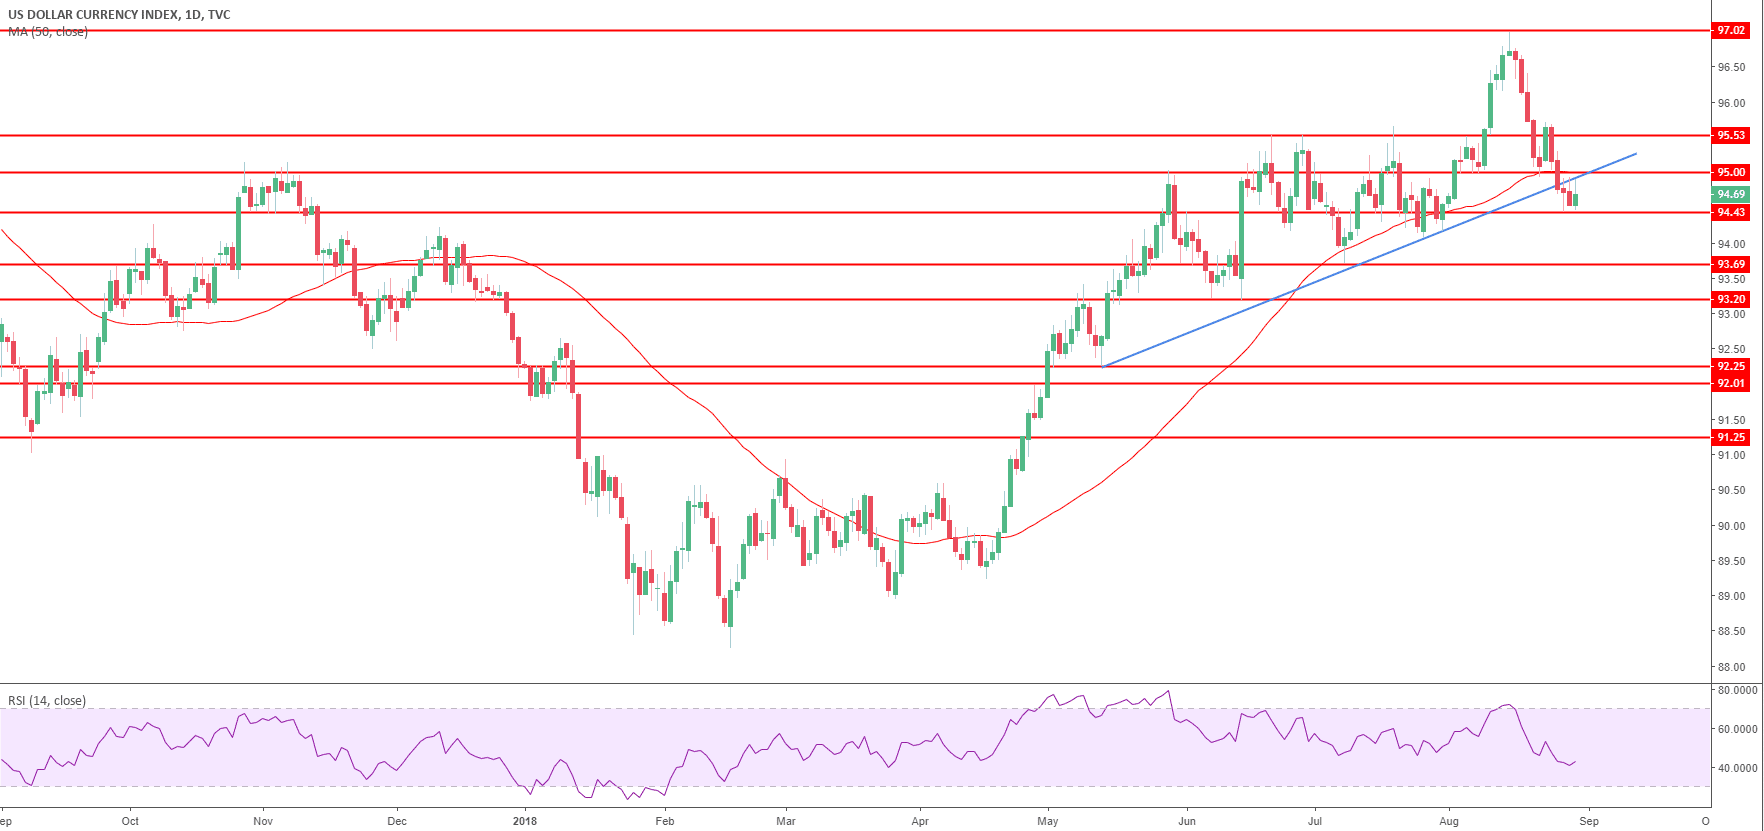
Spot rate: 94.70
Relative change: -0.02%
High: 94.70
Low: 94.69
Trend: Bullish
Resistance 1: 95.00 figure
Resistance 2: 95.24 July 13 high
Resistance 3: 95.52 August 6 high
Resistance 4: 96.00 figure
Resistance 5: 96.51 July 05, 2017 high
Support 1: 94.91 July 27 high
Support 2: 94.61 August 2, low
Support 3: 94.49 August 1 low
Support 4: 94.08 July 26 swing low
Support 5: 93.71 July 9 swing low
Support 6: 92.24 May 14 low
