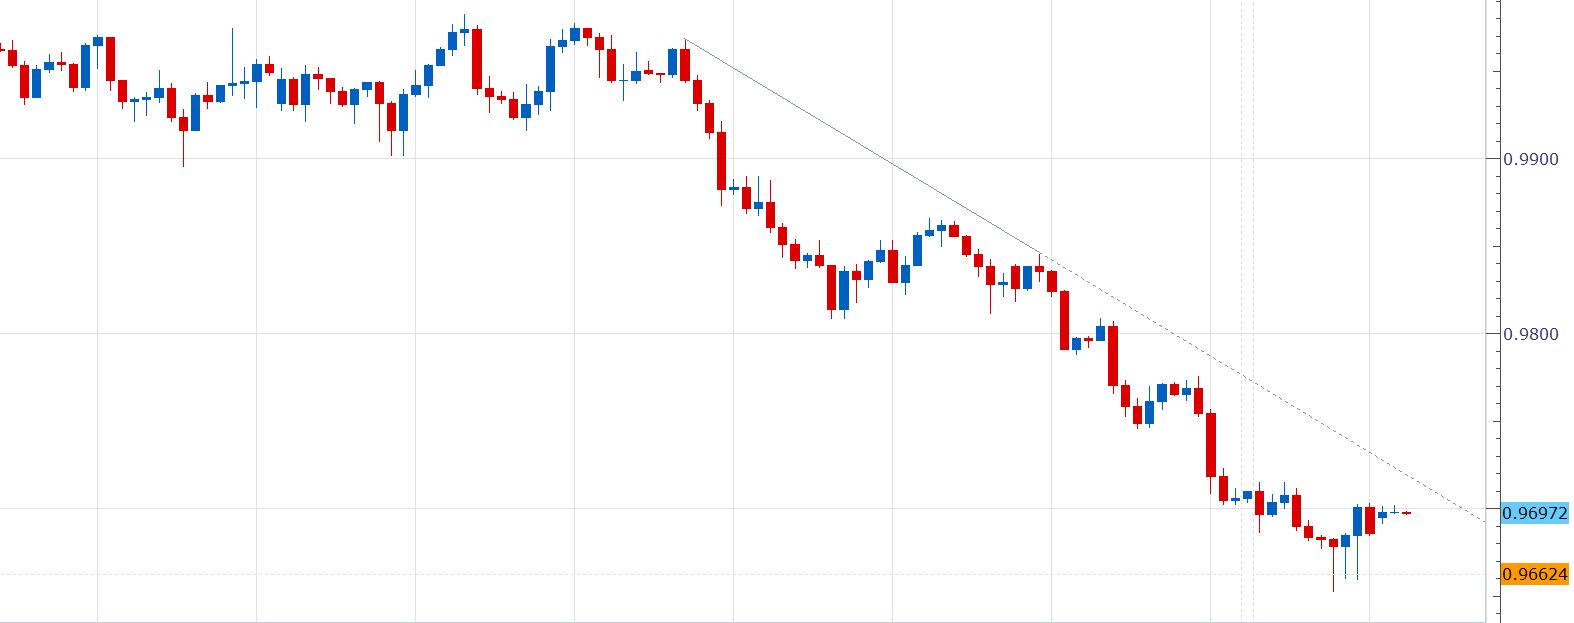
- The back-to-back “long-tailed” candle seen in the USD/CHF 4-hour chart indicates the sell-off from the Aug. 29 high of 0.9969 has likely run out of steam, although it is still too early to call a corrective rally as the falling trendline is intact.
- Further, the path of least resistance is to the downside as the 4H 100MA is located below the 200MA. So, a corrective rally above the falling trendline could be short-lived.
- As of now, the spot seems to have found a temporary bottom around 0.9652.
4-hour chart
Spot Rate: 0.97
Daily High: 0.9703
Daily Low: 0.9691
Trend: Neutral/bear exhaustion
R1: 0.9718 (falling trendline hurdle)
R2: 0.9745 (Aug. 28 low hurdle on the 4-hour chart)
R3: 0.9775 (falling 4H 50MA)
Support
S1: 0.9686 (session low)
S2: 0.9652 (last week’s low)
S3: 0.9628 (50% Fib R of 0.9188/ 1.00681)
