“¢ Last week’s rejection slide from the 0.6720-30 supply zone constituted towards the formation of a bearish double-top chart pattern on short-term charts.
“¢ A follow-through weakness below a descending trend-line support accelerated the downfall and reaffirmed the bearish formation.
“¢ With technical indicators on the 4-hourly chart holding in negative territory, the pair seems all set to continue with its well-established downward trajectory.
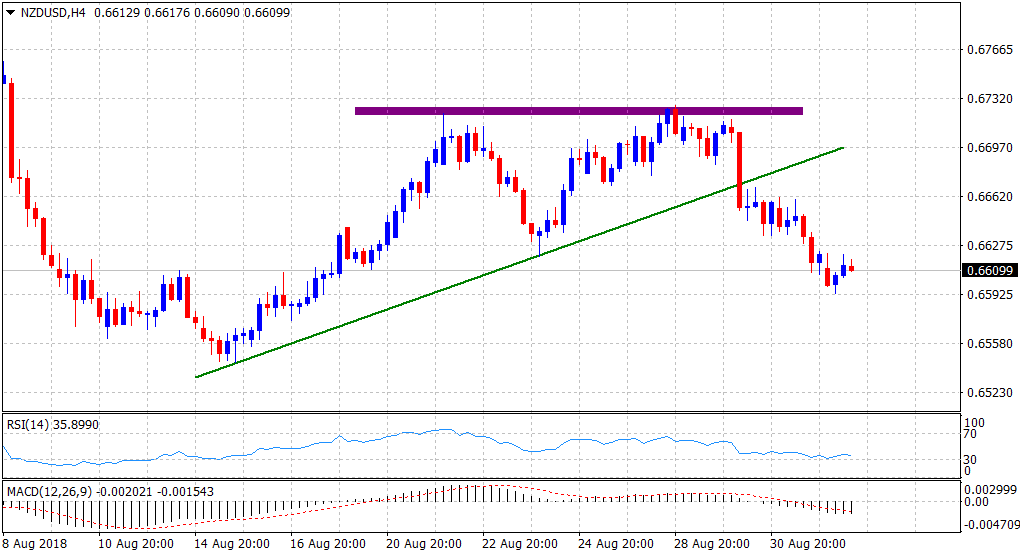
Spot Rate: 0.66099
Daily High: 0.6622
Daily Low: 0.6593
Trend: Bearish
Resistance
R1: 0.6622 (current day swing high)
R2: 0.6640 (horizontal zone)
R3: 0.6653 (R1 daily pivot-point)
Support
S1: 0.6597 (S1 daily pivot-point)
S2: 0.6565 (horizontal zone)
S3: 0.6544 (YTD low set on Aug. 15)
