“¢ The pair was seen oscillating in a narrow trading range through the mid-European session on Monday, forming a bearish flat chart pattern on the 15-min. chart.
“¢ The fact that the pair has shown some resilience at lower levels, bearish traders need to hold a break below 1.1600 for the next leg of downfall to materialize.
“¢ A convincing break below will now be seen as the end of the recent corrective bounce and the resumption of the underlying/well-established bearish trend.
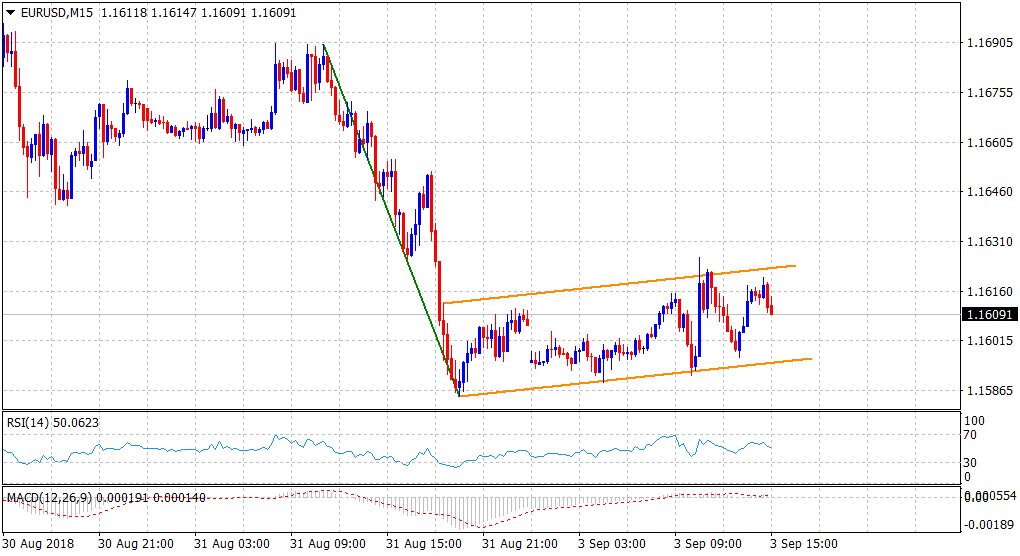
Spot Rate: 1.1609
Daily Low: 1.1589
Daily High: 1.1626
Trend: Bearish
Resistance
R1: 1.1626 (current day swing high)
R2: 1.1667 (100-period SMA H1)
R3: 1.1700 (round figure mark)
Support
S1: 1.1585 (one-week low set on Friday)
S2: 1.1561 (S1 daily pivot-point)
S3: 1.1530 (horizontal zone)
