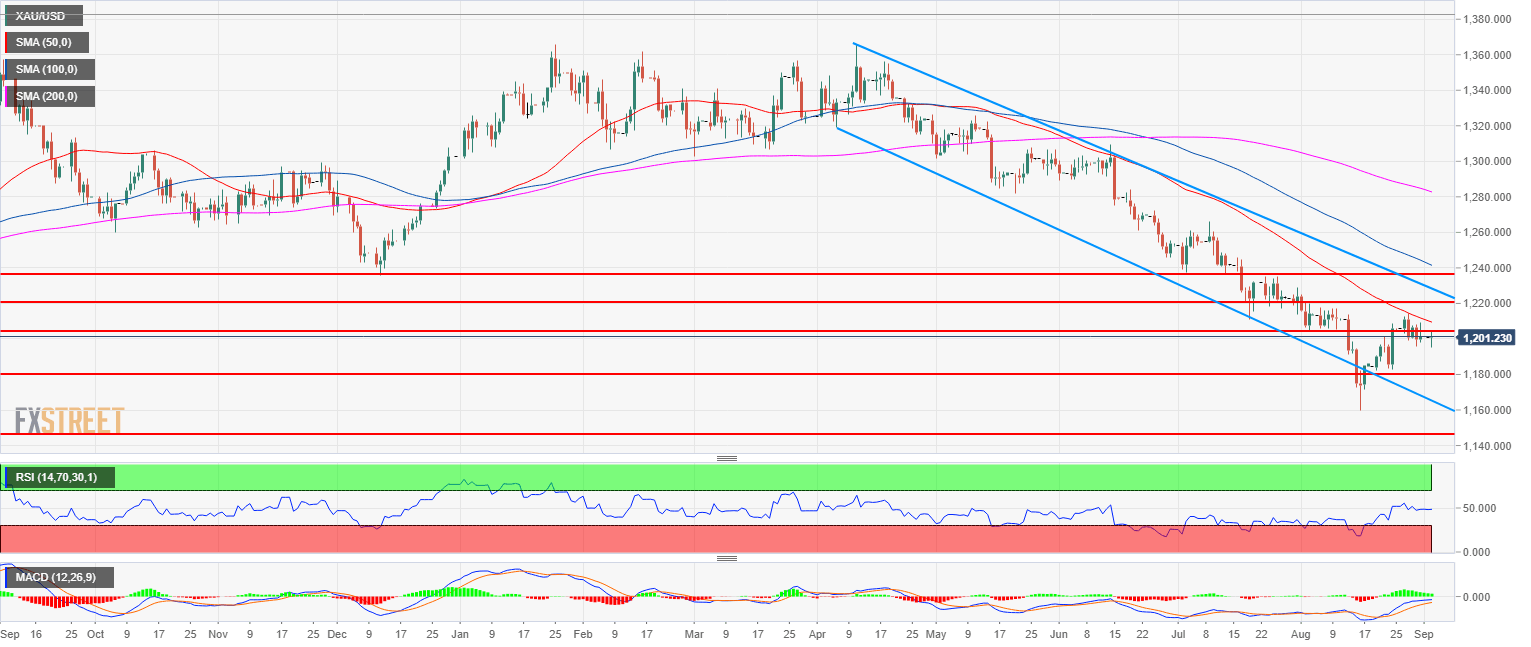
- Gold bear trend has been on hold for the last two weeks.
- Gold is trading in a bear channel with downward sloping simple moving averages. However, the RSI and MACD indicators are showing signs of bearish exhaustion and the market might be bottoming out. Gold is in a range between 1,182.90 and 1,204.10.
- Bulls have a slight advantage especially if they manage to keep the market above 1,204.10. A bull breakout above 1,220.90 would be considered as bullish as it would create a higher highs on the daily chart.
Spot rate: 1,201.40
Relative change: 0.03%
High: 1,204.00
Low: 1,195.30
Trend: Bearish
Short-term trend: Bullish reversal attempt
Resistance 1: 1,204.10, August 3 swing low (key level)
Resistance 2: 1,211.17 July 19 low
Resistance 3: 1,213.70 July 31 low
Resistance 4: 1,217.89-1,220.90 zone, August 6 high and July 18 low
Resistance 5: 1,225.90 July 17 low
Support 1: 1,194.30 March 10, 2017 low
Support 2: 1,182.90 August 24 low
Support 3: 1,172.82 current 2018 low
