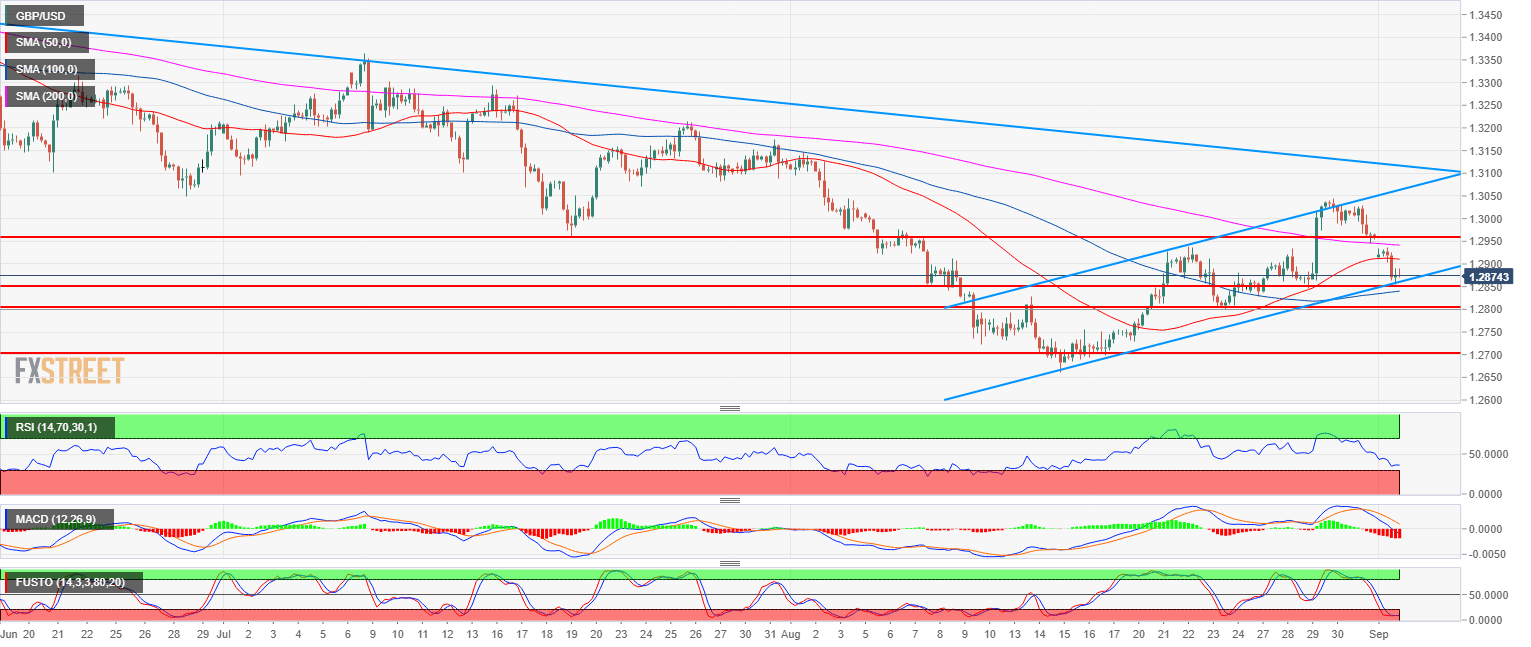
- GBP/USD bears are keeping the market under pressure as GBP/USD is trading below the 50 and 200-period simple moving average (SMA) on the 4-hour chart.
- GBP/USD is currently consolidating the recent leg down and bears need a breakout below 1.2845, (August 29 low) in order to confirm the bear trend continuation.
- A the time of writing bears have the advantage but things can turn around quickly if bulls breakout above the 1.2900 figure. In fact, this would likely put the current bear leg on hold as buyers would try to keep the bull channel in place.
Spot rate: 1.2870
Relative change: -0.63%
High: 1.2935
Low: 1.2855
Main trend: Bearish
Short-term trend: Bullish above 1.2900
Resistance 1: 1.2868 August 22 low
Resistance 2: 1.2900 figure
Resistance 3: 1.2937 August 22 swing high
Resistance 4: 1.2957 July 19 swing low
Resistance 5: 1.3000 figure
Support 1: 1.2868 August 22 low
Support 2: 1.2845, August 29 low
Support 3: 1.2800 swing low
Support 4: 1.2700-1.2723 zone, figure and August 10 low
