- Crude oil is testing the 70.00 figure which has been a strong resistance in the last months of trading.
- While bulls are trying to revive the main bull trend they will need to overcome the 70.00 figure resistance. There is not a clear top yet, however, repeated failures above 70.00 can lead to a rotation down towards 68.00-68.30 zone (figure and supply/demand level).
- Investors are going to closely monitor how the market behaves near 70.00 in order to decide what is the next directional move on the black gold.
Crude oil WTI 480-minute chart
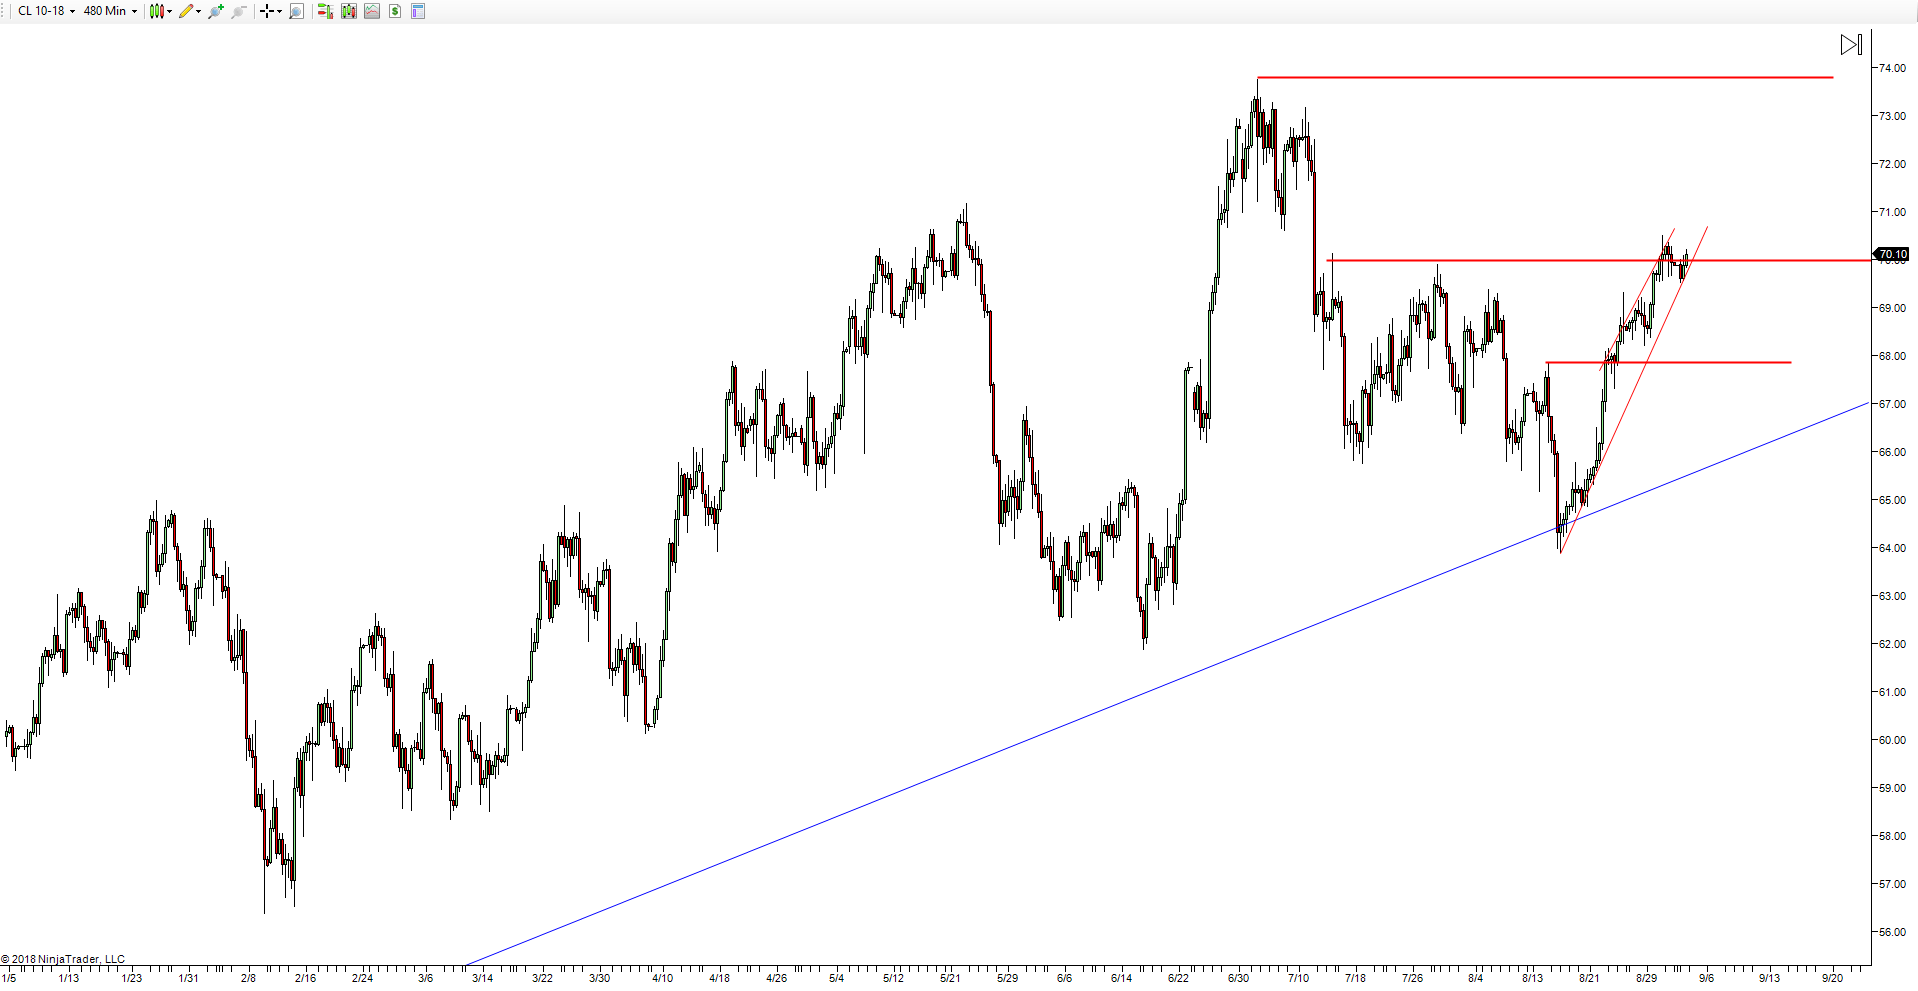
Spot rate: 60.00
Relative change: 0.23%
High: 70.19
Low: 69.50
Main Trend: Bullish
Short-term trend: Bearish below 70.00
Resistance 1: 70.00 figure
Resistance 2: 70.53 May 24 low
Resistance 3: 71.19 May 23 low
Resistance 4: 72.13 July 6 low
Support 1: 69.44 June 25 high
Support 2: 69.30 August 24 high
Support 3: 69.00 figure
Support 4: 68.00-68.30 zone, figure and supply/demand level
