“¢ The pair built on last week’s goodish rebound from 2-1/2 month lows and continued gaining positive traction for the fourth consecutive session.
“¢ The momentum assisted the pair to surpass 50-day SMA hurdle and finally break-through over two-month-old downward sloping trend channel.
“¢ Mixed technical indicators on the daily chart are yet to catch up with the latest bullish breakout, suggesting a possible pause before any further up-move.
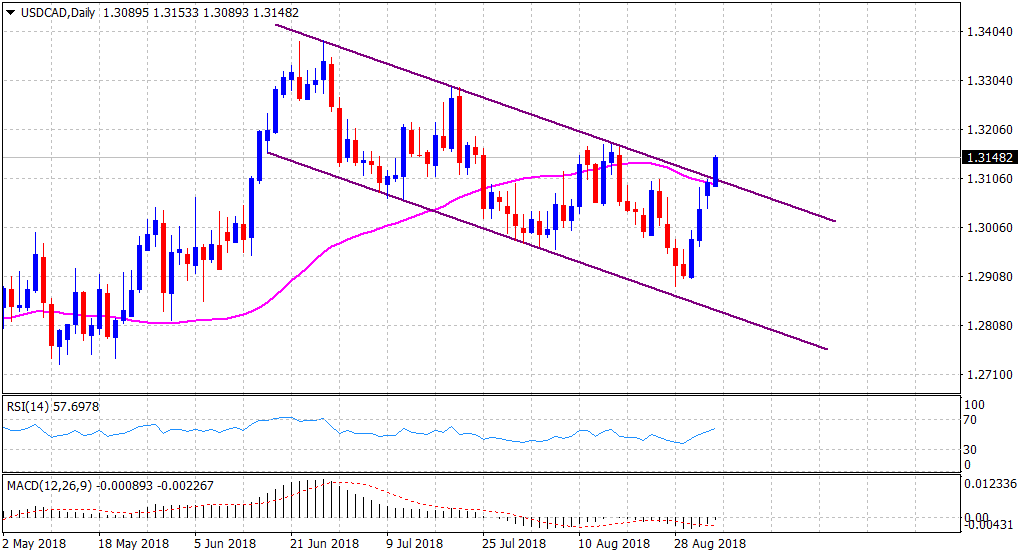
Spot Rate: 1.3148
Daily Low: 1.3089
Trend: Bullish
Resistance
R1: 1.3175 (August monthly swing high)
R2: 1.3200 (round figure mark)
R3: 1.3220 (horizontal zone)
Support
S1: 1.3115 (trend-channel resistance break-point)
S2: 1.3089 (current day swing low)
S3: 1.3057 (S1 daily pivot-point)
