- USD/JPY is in consolidation mode for the eight day in a row as buyers want to resume the main bull trend.
- The 50-period simple moving average (SMA) on the 4-hour chart broke above the 100 and 200 SMA suggesting that the market is gathering some bullish momentum. USD/JPY is also progressing above a bullish trendline.
- If bulls manage to break above the bear trendline the market can target the 112.00 and 113.00 figures.
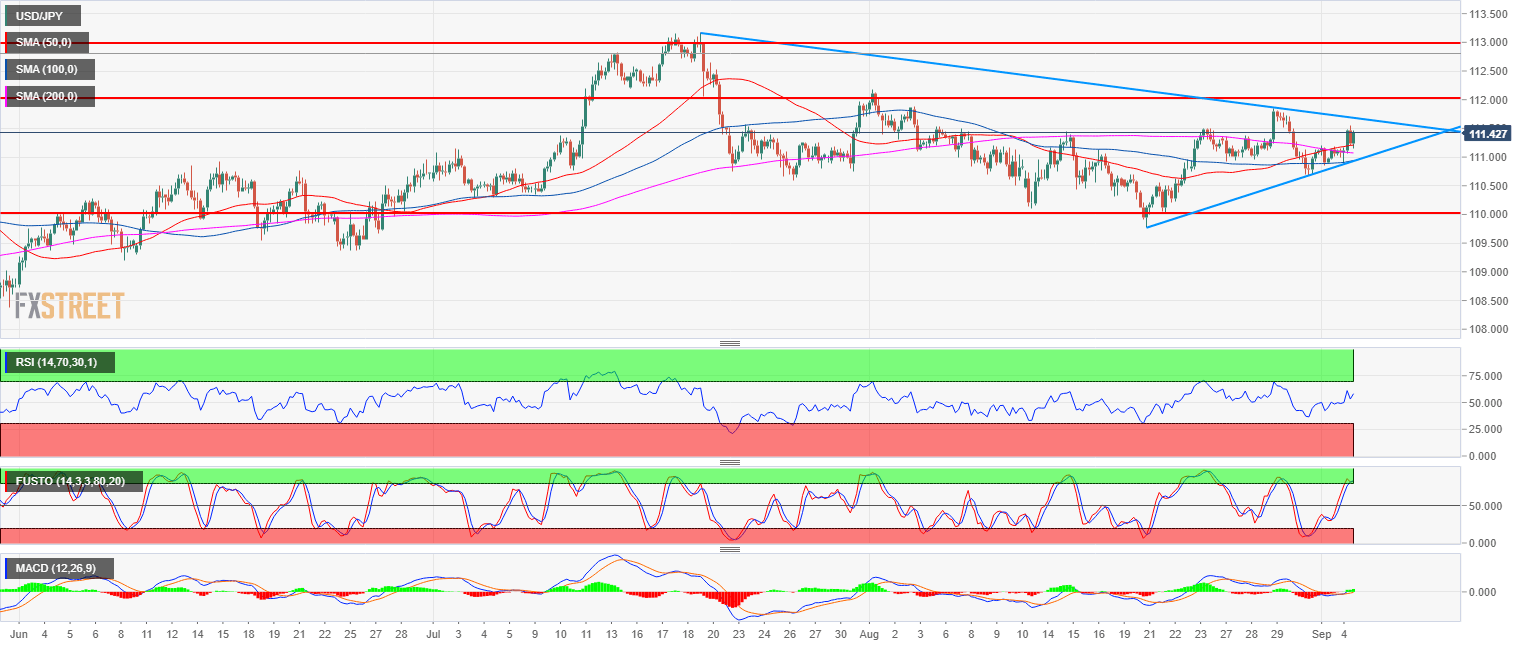
Spot rate: 111.43
Relative change: 0.33%
High: 111.55
Low: 110.89
Main trend: Bullish
Resistance 1: 111.45 August 8 high
Resistance 2: 111.54-111.64 area, August 6, high and supply/demand level
Resistance 3: 112.00-112.15 zone, figure and August 1, swing high
Resistance 4: 112.40 supply level
Resistance 5: 113.18, 2018 high
Support 1: 111.00 figure
Support 2: 110.75, July 23 low
Support 3: 110.00 figure
Support 4: 109.37 June 25 low
