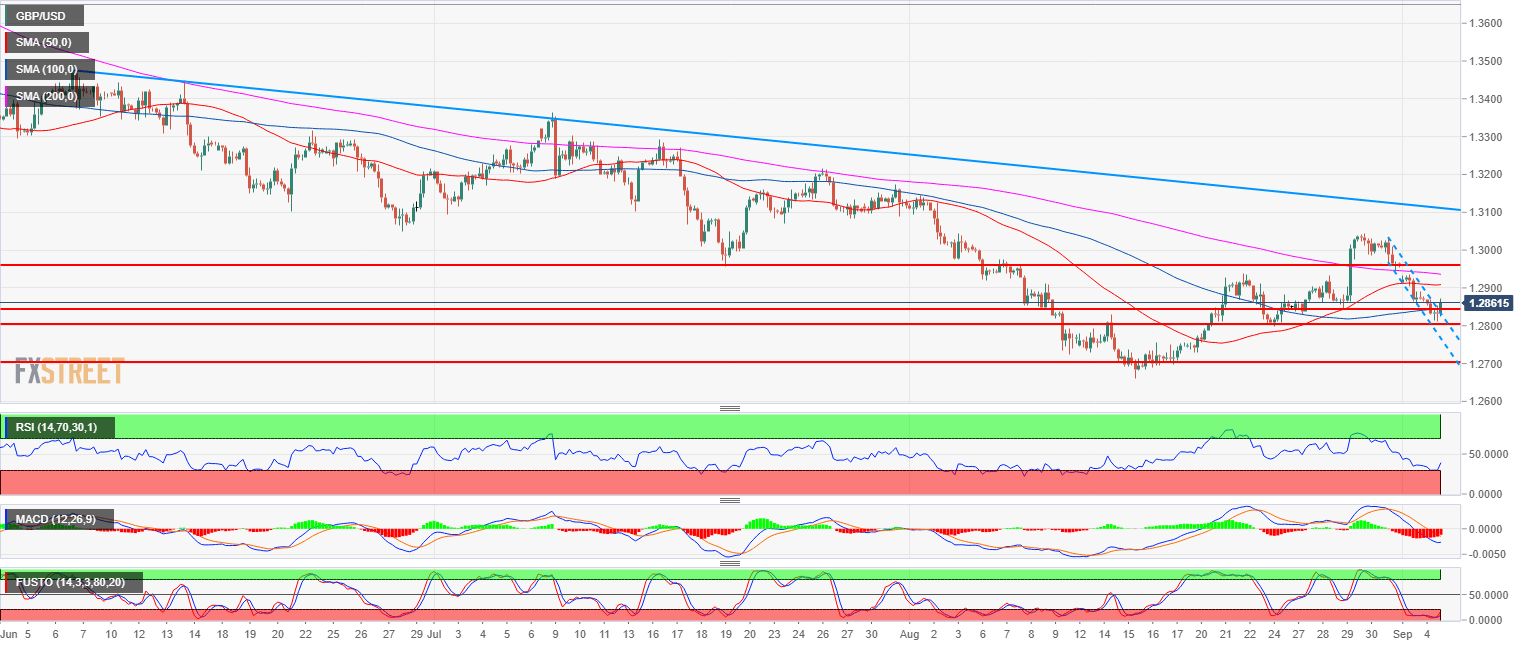
- GBP/USD sellers are keeping the main bear trend going as GBP/USD is trading below its 200-period simple moving average (SMA) on the 4-hour chart.
- GBP/USD is finding some support above 1.2800 August 24 swing low. The market broke above the tight bear channel and bulls are currently trying to put an end to the bear leg of the last four days. If bulls manage to break above 1.2900, it would be considered a strong bullish statement which could lead to an acceleration towards 1.2957 July 19 swing low and 1.3000 figure.
- A bear breakout below 1.2800 would invalidate the short-term bullish reversal.
Spot rate: 1.2861
Relative change: -0.07%
High: 1.2877
Low: 1.2810
Main trend: Bearish
Short-term trend: Bullish above 1.2800
Resistance 1: 1.2868 August 22 low
Resistance 2: 1.2868 August 22 low
Resistance 3: 1.2900 figure
Resistance 4: 1.2937 August 22 swing high
Resistance 5: 1.2957 July 19 swing low
Resistance 6: 1.3000 figure
Support 1: 1.2845, August 29 low
Support 2: 1.2800 August 24 swing low
Support 3: 1.2700-1.2723 zone, figure and August 10 low
