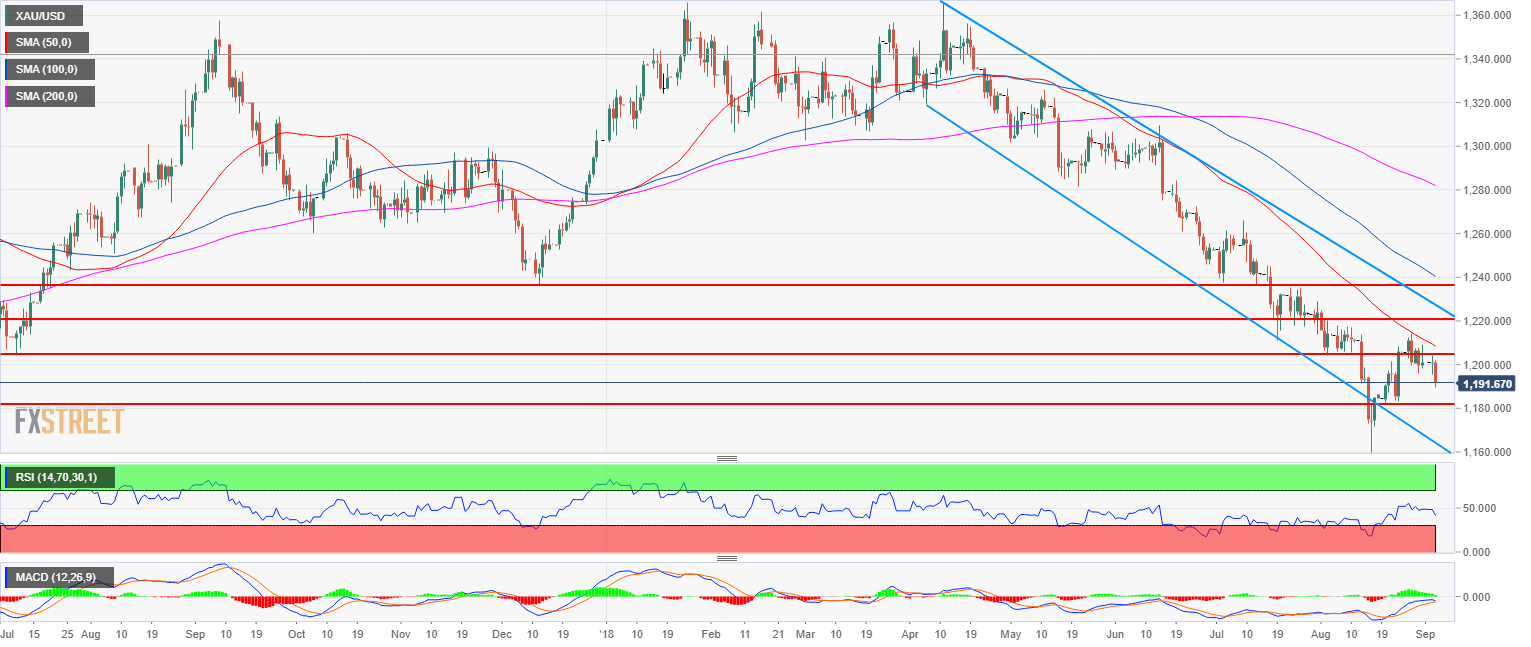
- Gold bear trend has been slowing down in the last two weeks as the market has found a bottom at 1,172.82.
- Gold is trading below its 50, 100 and 200-day simple moving averages while the RSI is below 50, all suggesting that the Yellow Metal has room to fall to 1,182.90 (August 24 low).
- A bull breakout above 1,204.10 (August 3 swing low and key level) would invalidate the bearish bias.
Spot rate: 1,191.68
Relative change: -0.78%
High: 1,202.03
Low: 1,189.49
Trend: Bearish
Resistance 1: 1,194.30 March 10, 2017 low
Resistance 2: 1,204.10, August 3 swing low (key level)
Resistance 3: 1,211.17 July 19 low
Resistance 4: 1,213.70 July 31 low
Resistance 5: 1,217.89-1,220.90 zone, August 6 high and July 18 low
Resistance 6: 1,225.90 July 17 low
Support 1: 1,182.90 August 24 low
Support 2: 1,172.82 current 2018 low
Support 3: 1,145.20 March, 1 2017 low
