- AUD/JPY takes the bids near monthly high flashed earlier in November.
- Bullish MACD, sustained trading beyond 10-day and 50-day SMAs favor the buyers.
- 50-day SMA offers additional filter to the downside.
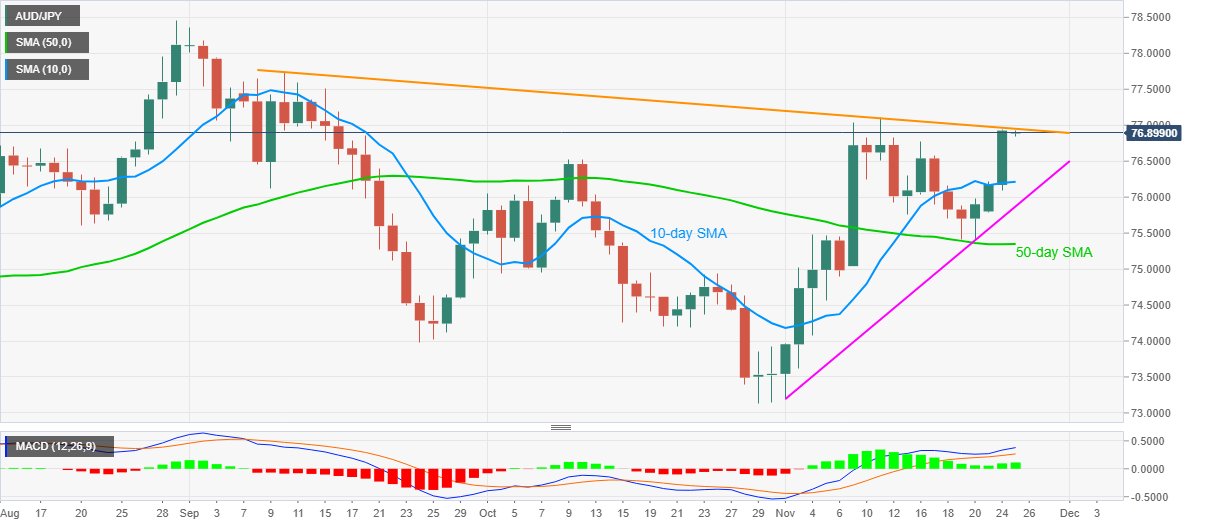
AUD/JPY rises to 76.92 amid the initial Asian session on Wednesday. The pair jumped towards the monthly, flashed on November 11, while cheering the upside break of 10-day SMA the previous day. However, a falling trend line from September 10 challenges the bulls by press time.
Even so, bullish MACD and the pair’s successful trading above the key SMAs keep the buyers hopeful of breaking the 76.95 immediate upside hurdle while eyeing the 77.00 threshold.
It should also be noted that the monthly peak near 77.10 also challenges the AUD/JPY bulls before propelling them to the September 10 high of 77.73.
Meanwhile, October’s top around 76.50 offers immediate support should the quote takes a U-turn from the key resistance line. Though, 10-day and 50-day SMA levels, respectively close to 76.20 and 75.30, may probe the sellers afterward.
During the downside, AUD/JPY bears may catch a breather around the 76.00 round-figure and an upward sloping trend line from November 02, at 75.87 now.
AUD/JPY daily chart
Trend: Bullish
