- AUD/JPY is in the hands of the bulls at the moment, with price trapped between support and resistance.
- A break of the support structure on the 4-hour time frames will open prospects of a bearish bias and breakout of sideways chop.
Further to the prior analysis, AUD/JPY Price Analysis: Bears on the lookout for a test of critical daily support, the price has indeed moved into the important resistance area that meets a 61.8% Fibonacci area.
The following is a top-down analysis that brings us up to date with the current price action.
As per the above analysis, we were waiting for a move into resistance as follows:
Prior analysis, 4-hour chart
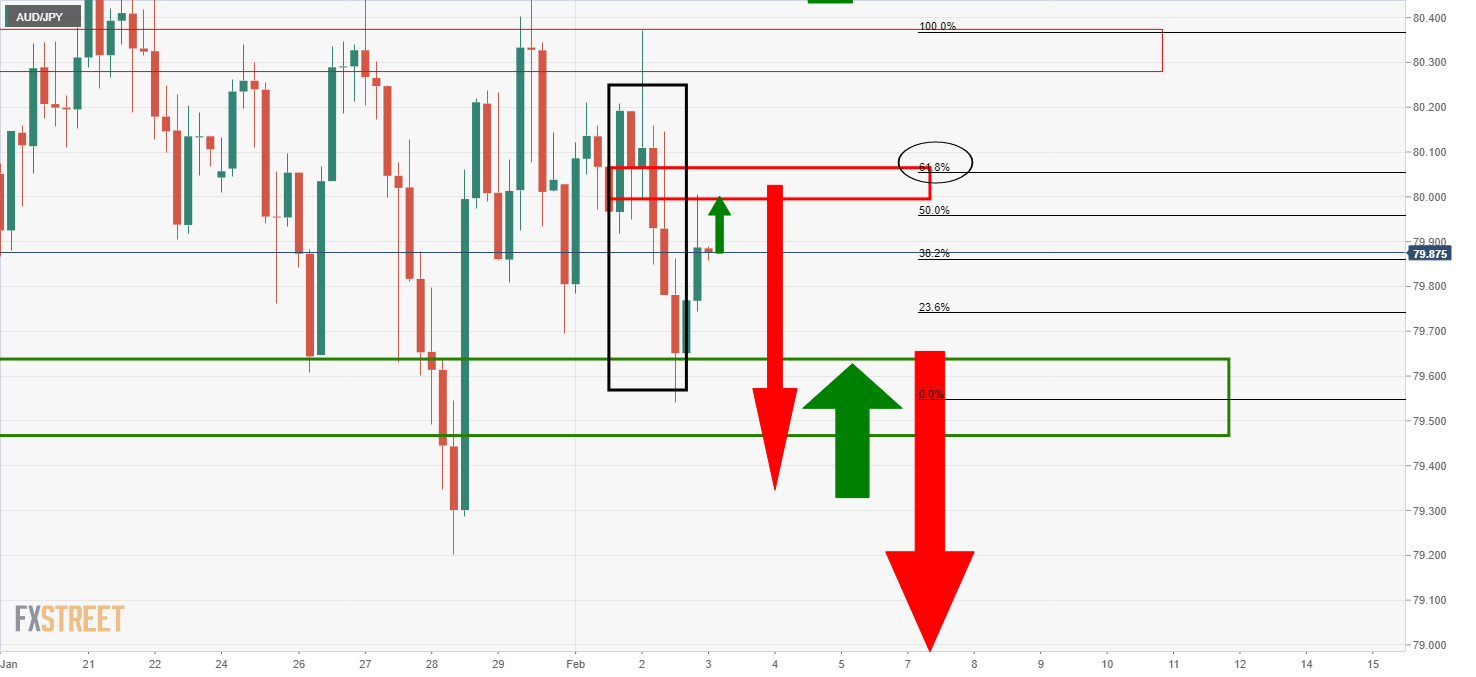
Live market, 4-hour chart
-637479805810484513.png)
As illustrated, the price has moved into the critical resistance zone but given the structure of the price action, it now needs to break lower and below the meanwhile support that has been created.
In doing so, the technical environment will turn convincingly bearish as measured by MACD with the price below the moving averages, 50, 21 and 10.
On a retest of the old support, it would be expected to act as resistance and would offer the prospects of a structure that could guard a stop-loss order while bears can target the downside and major support area.
Prior analysis, daily chart
-637479109877378143.png)
Live market, daily chart
-637479809272771088.png)
The 10-day moving average crossing below the 21-day moving average is significantly bearish while the price makes lower highs below the resistance area.
