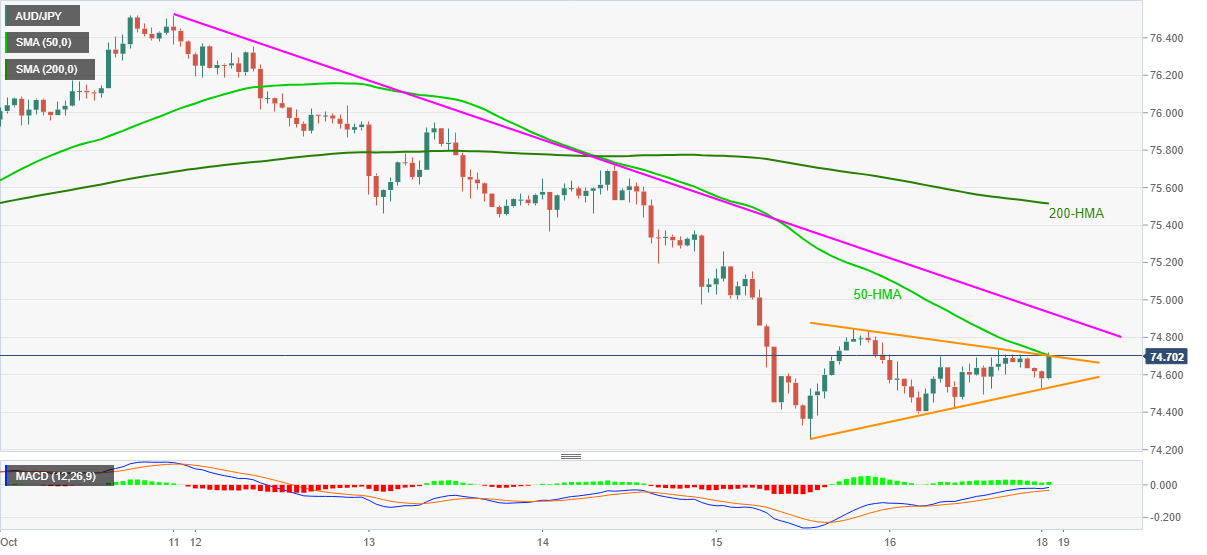
- AUD/JPY picks up the bids inside a two-day-old symmetrical triangle.
- 50-HMA adds strength into the triangle resistance, one-week-long falling trend line, 200-HMA offer extra upside barriers.
- September low can lure bears after the triangle’s downside break.
AUD/JPY rises to 74.70 during the early Asian session on Monday. Although the pair gained bids in the last hour, a short-term symmetrical triangle restricts immediate moves. However, a falling trend line from October 11 and key HMAs probe the bulls.
As a result, the pair’s run-up below the 200-HMA level of 75.52 is less likely to please the bulls. Though, a clear break above 74.71 resistance confluence, comprising the triangle’s resistance and 50-HMA, can help AUD/JPY buyers to attack 74.95.
In a case where the quote crosses 75.52, the 76.00 threshold and the monthly high of 76.52 will gain market attention.
On the contrary, a downside break of the triangle’s support, near 74.50, can challenge the monthly bottom surrounding 74.25 ahead of directing AUD/JPY prices towards the previous month’s low of 73.97.
During the pair’s sustained trading below 73.97, June 12 low of 72.52 will be in the spotlight.
AUD/JPY hourly chart
Trend: Bearish
