- AUD/JPY bulls catch a breather after fetching the quote up from 75.10 the previous day.
- Bearish MACD suggests weakness in upside momentum, an ascending trend line from June 26 adds to the support.
- Multiple resistances stay ready to question the pair’s north-run below 77.00.
AUD/JPY seesaws around 75.50 amid the early hour of the Aussie market open on Tuesday. The pair marked a negative daily closing on Monday. However, losses couldn’t break the range between 21 and 10-day SMA. Even so, bearish MACD signals suggest mixed clues, which in turn highlight the traders’ pause ahead of the key RBA.
Read: RBA Preview: COVID running a muck? An Exy Aussie? Nah, no worries mate!
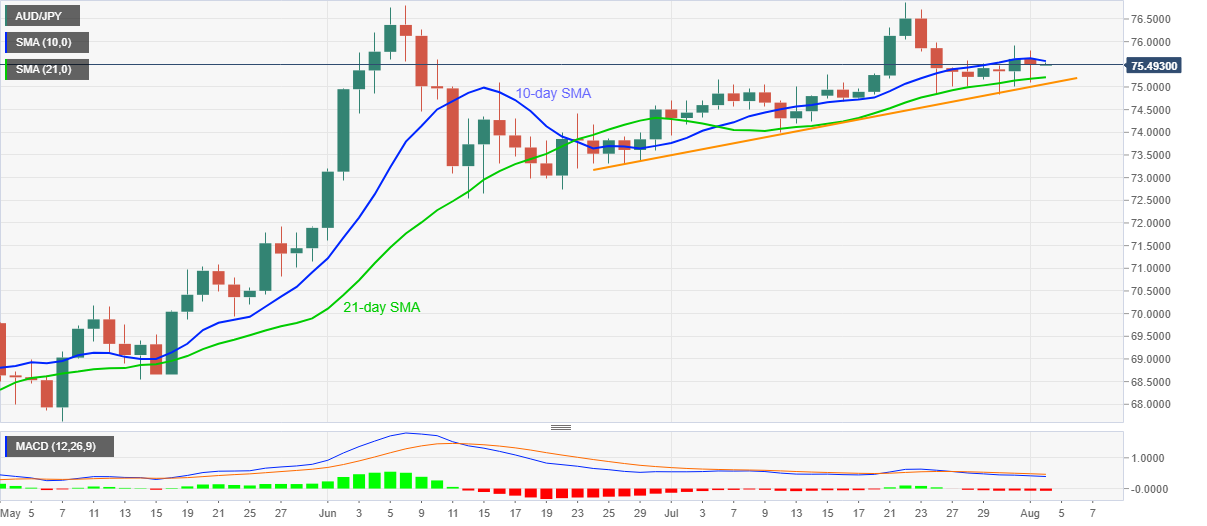
Other than the immediate support of 21-day SMA, currently around 75.20, a five-week-old ascending trend line, at 75.06 now, also poses challenges to the sellers.
Additionally, a downside break of 75.06 will need validation from 75.00 before attacking the previous month’s low of 73.98.
Alternatively, a 10-day SMA level of 75.57 precedes Friday’s top near 75.92 and 76.00 round-figures to mark upside barriers.
Even if the pair manages to cross 76.00 on a daily closing basis, highs printed during June and July, respectively around 76.80 and 76.90, will be the strong resistances holding keys for the pair’s rise beyond 77.00.
AUD/JPY daily chart
Trend: Pullback expected
